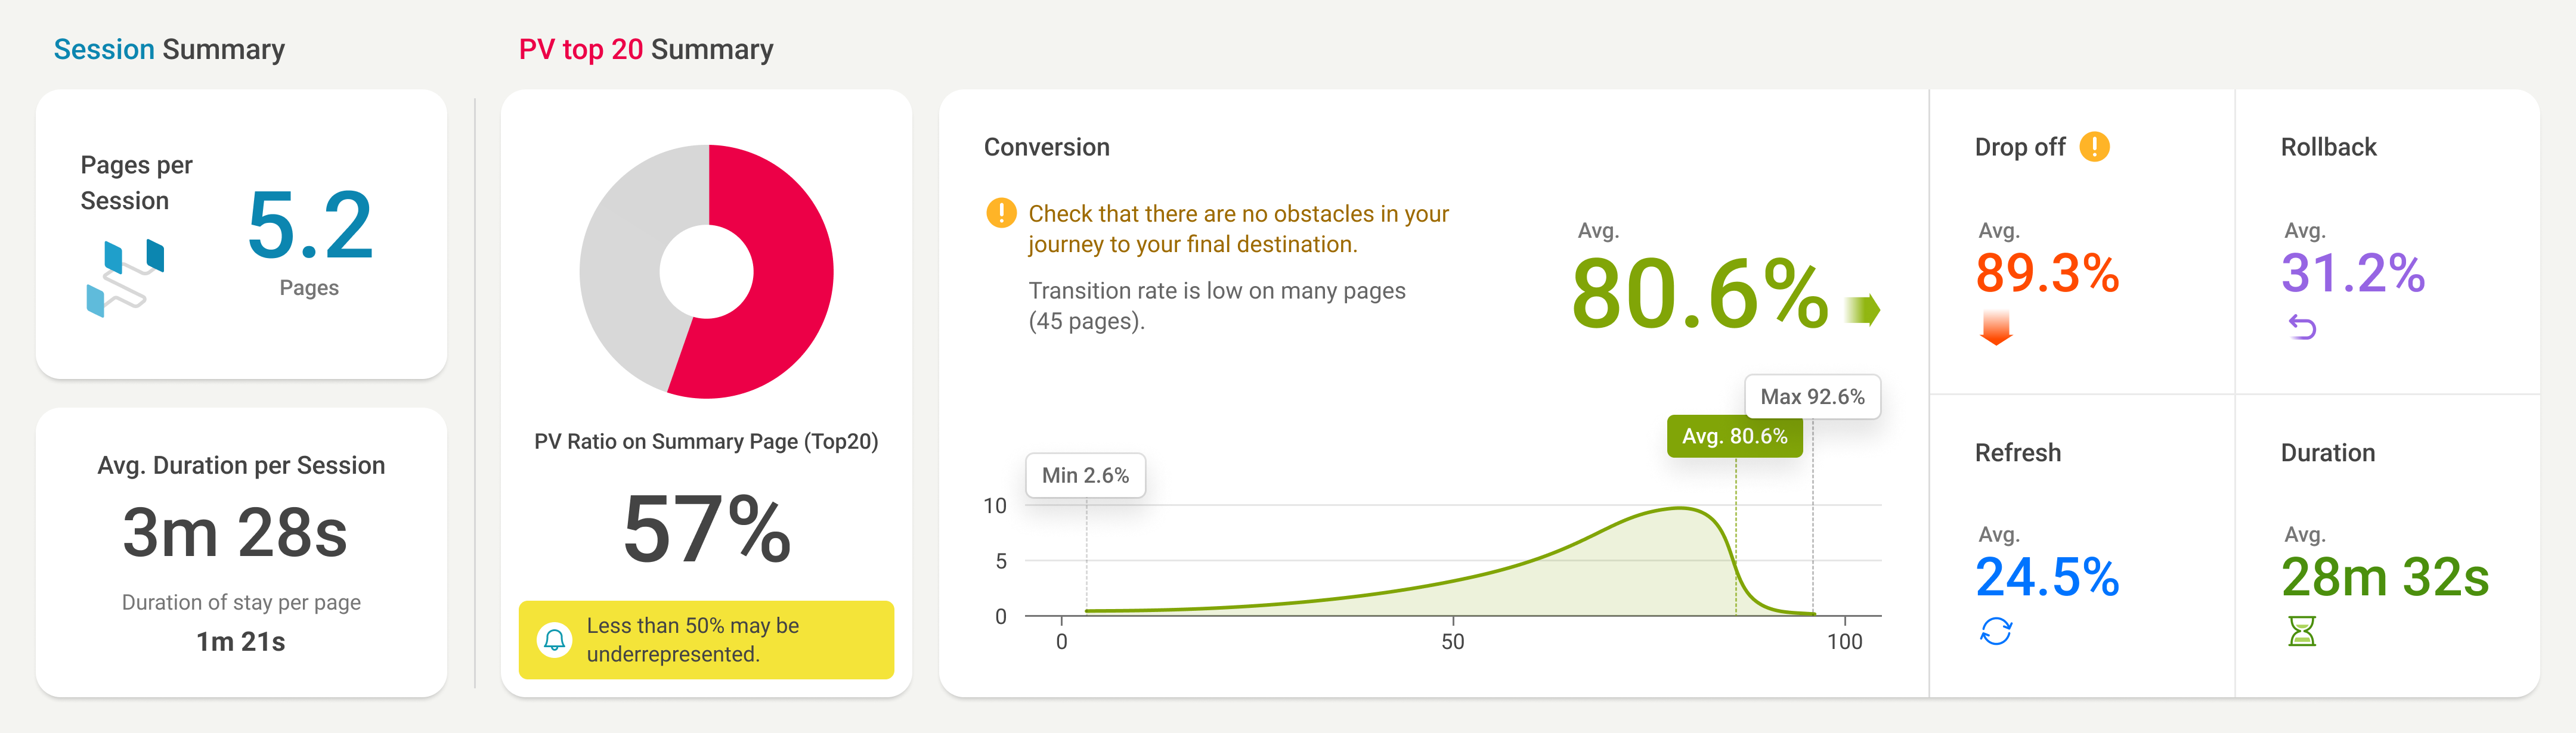
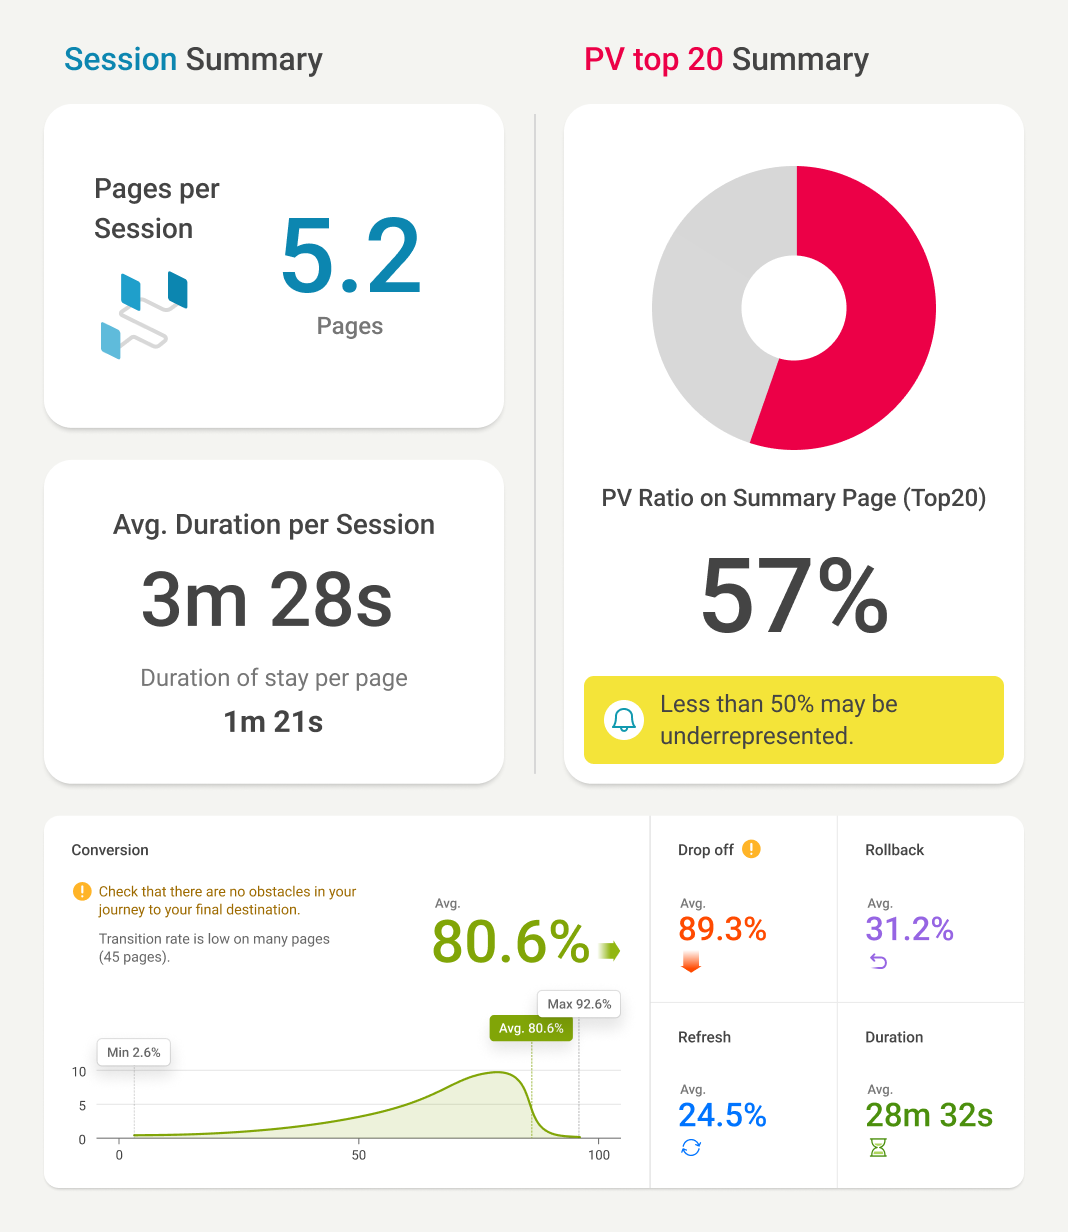
We show the key metrics to understand user experiences so you can monitor areas that need optimization at a glance.
Want to analyze user experience? Just take a look at this!
Were you unsure how to interpret the constant data and various metrics? We show where users face difficulties and metrics that are needed for optimizations. Monitor what needs to be inspected and what needs to be improved with Beuasble.
How do users navigate your website and where do they drop-off the most?
Inspect and monitor your service by looking at conversion and drop-off metics for each step of the journey.
Conversion
Easily check whether customers are following the itnended purchase flow through conversion arrows.
Drop-off
Are users not completing purchases? Observe whether unexpected drop-offs are occuring during the checkout process.
Conversion
Easily check whether customers are following the itnended purchase flow through conversion arrows.
Drop-off
Are users not completing purchases? Observe whether unexpected drop-offs are occuring during the checkout process.
What could be the cause of massive drop-offs?
Analyze with metrics that reflect points of failure.
Rollback
Curious where users experience failure? The rollback metric shows where users backtrack to a previous page after experiencing failure.
Refresh
Are users facing technical difficulties due to slow server or network connections? The refresh metric shows points where users are facing difficulties.
Visit Duration
What pages do users spend the most time? You can view the average visit duration per step of the journey.