잠재 고객의 동선을 분석하고
자사 쇼핑몰의 구매 전환율을 개선해 보세요.
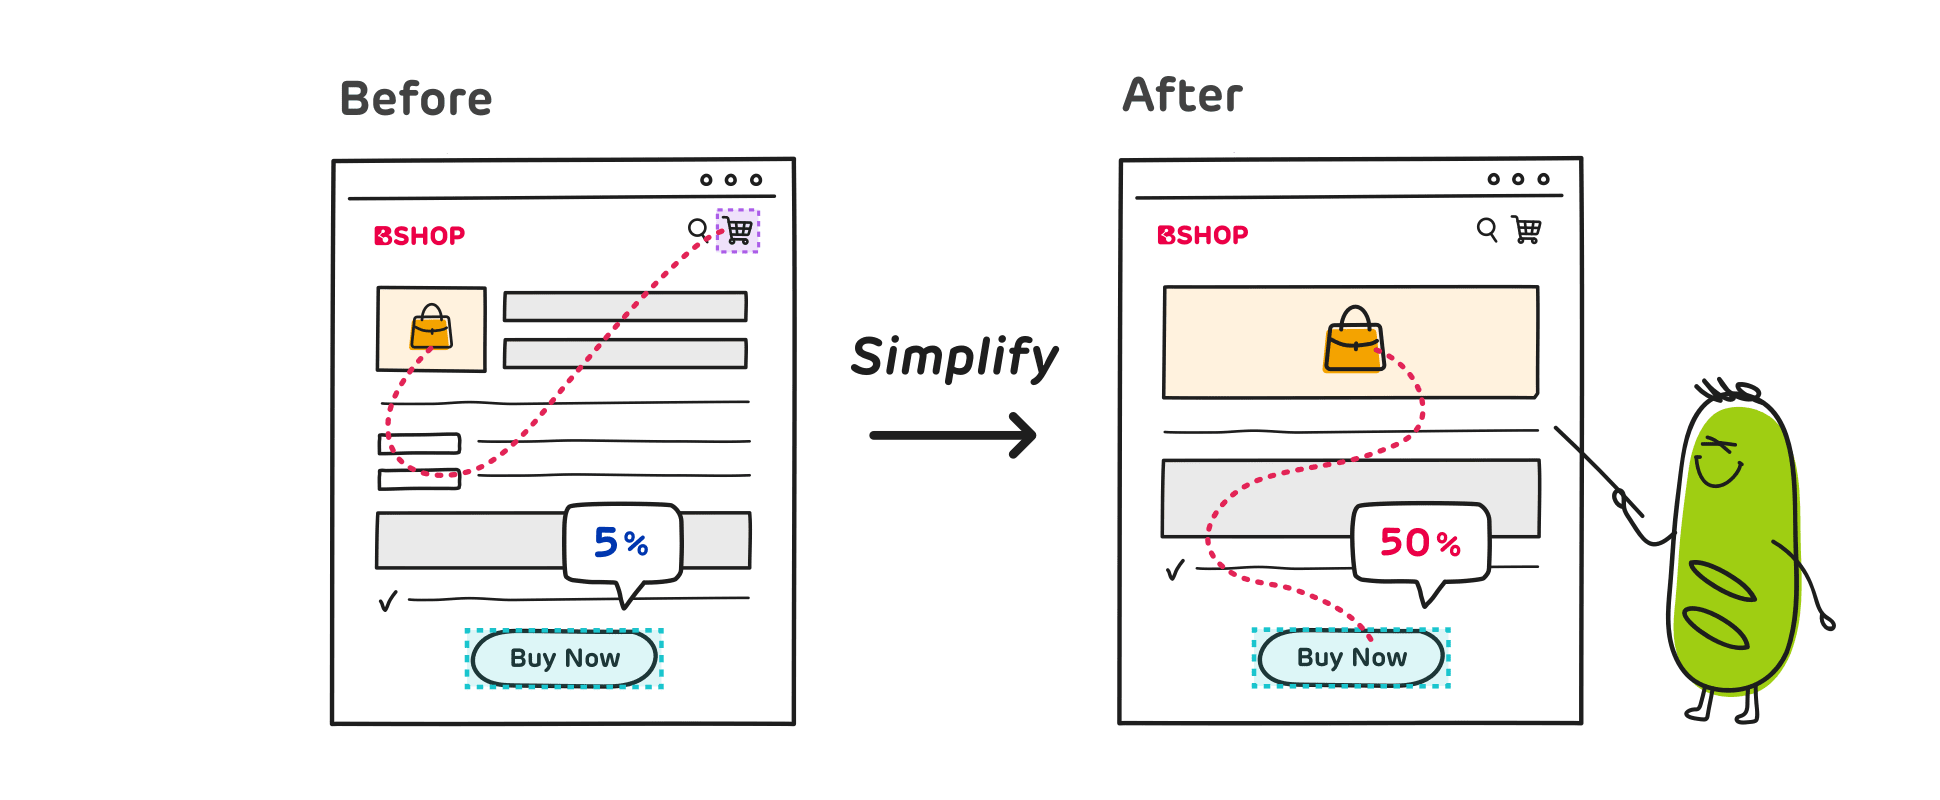
장바구니를 거쳐 결제 단계까지는 진입하는데, 왜 구매까지 이어지지 않는 걸까요? 이탈한 고객의 동선과 히트맵을 분석하여 어려움을 겪는 요인은 없는지 파악하여 최종 전환율을 높이기 위한 개선 인사이트를 얻어보세요.
뷰저블은 기업의 규모와 업종에 상관없이
누구나 쉽고 빠르게 활용이 가능합니다.
장바구니를 거쳐 결제 단계까지는 진입하는데, 왜 구매까지 이어지지 않는 걸까요? 이탈한 고객의 동선과 히트맵을 분석하여 어려움을 겪는 요인은 없는지 파악하여 최종 전환율을 높이기 위한 개선 인사이트를 얻어보세요.
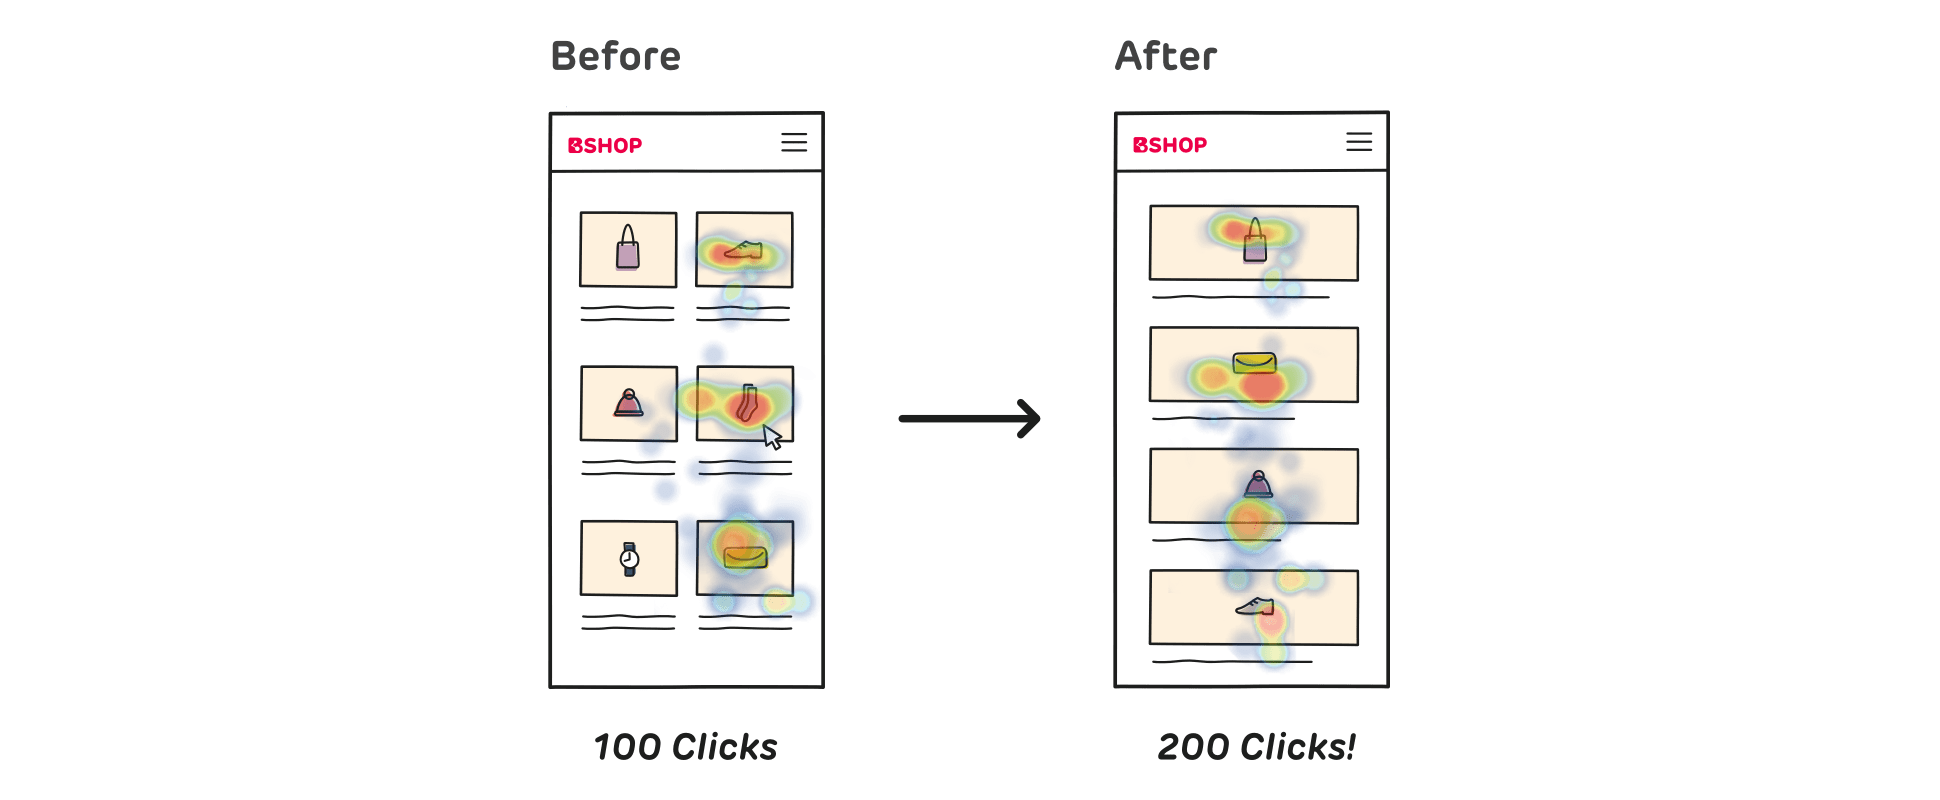
모바일 히트맵을 통해 상품 목록 페이지 오른쪽에 나열된 상품으로
전환하는 공통적인 사용자 패턴을 파악하고, 이를 반영한 모바일에 최적화된 레이아웃으로
개선하여 상품 페이지로의 전환율을 2배 이상 늘려보세요.
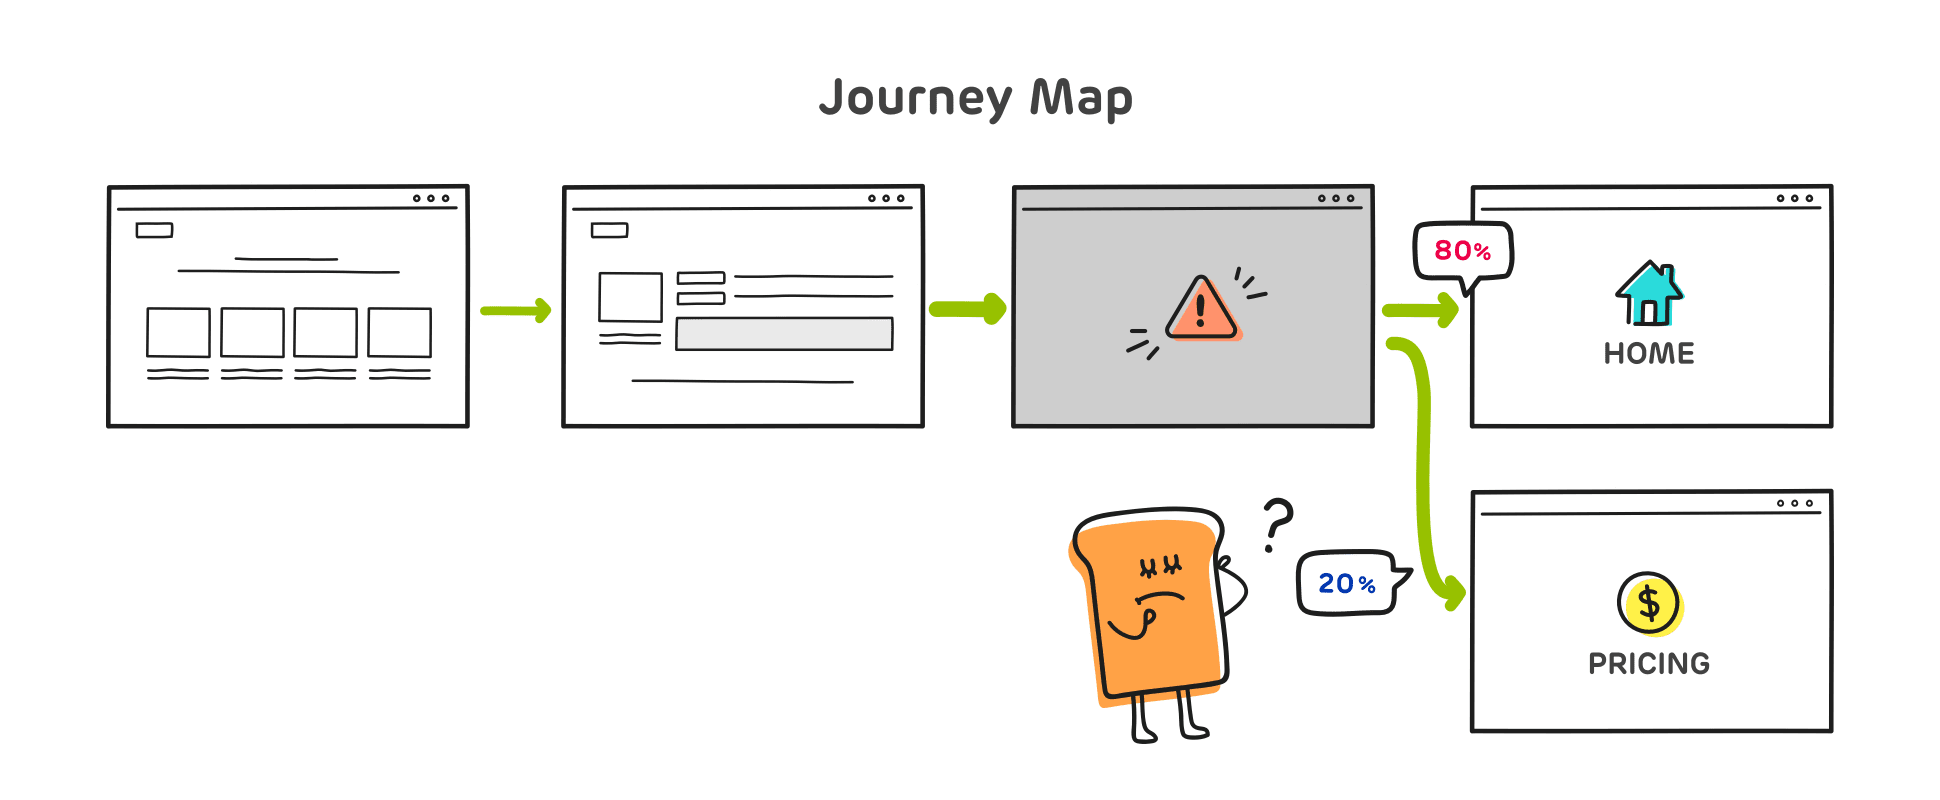
의도한 요금제 페이지로 전환하지 않고 메인 페이지로 되돌아오는 비율이 높나요?
실패 여정의 원인 파악을 위해 UX Heatmap으로 이벤트 페이지를 분석해 보세요.
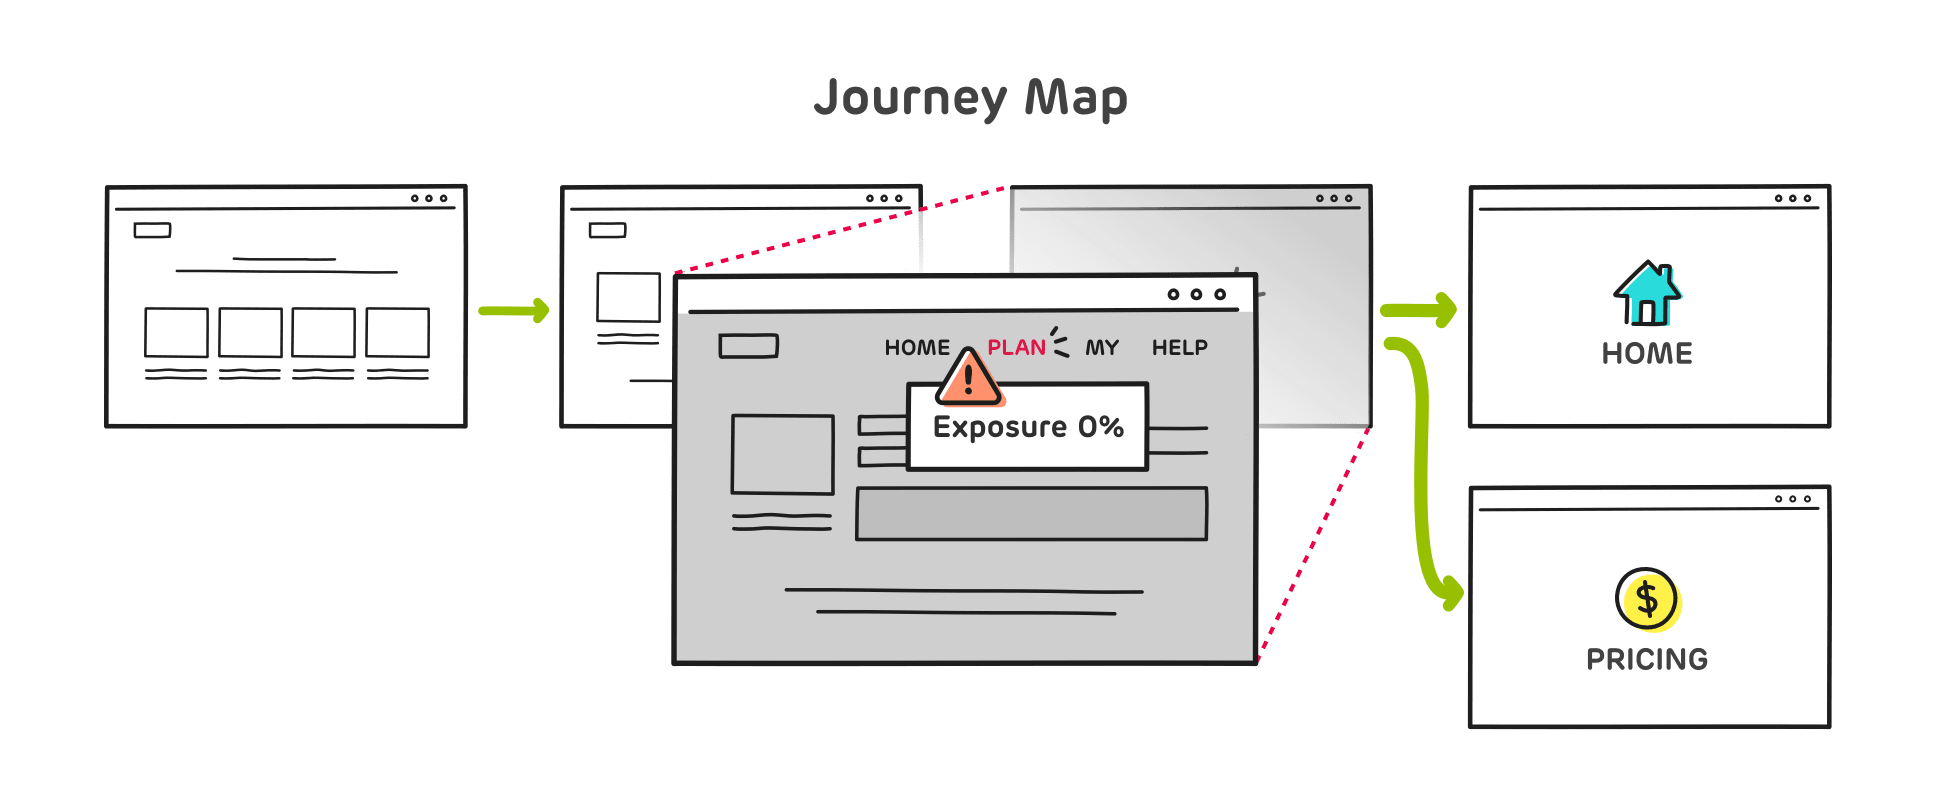
활용도가 낮은 GNB 메뉴의 구조와 인터랙션을 변경하여
의도한 요금제 페이지로 빠르게 전환할 수 있도록 개선해 보세요.
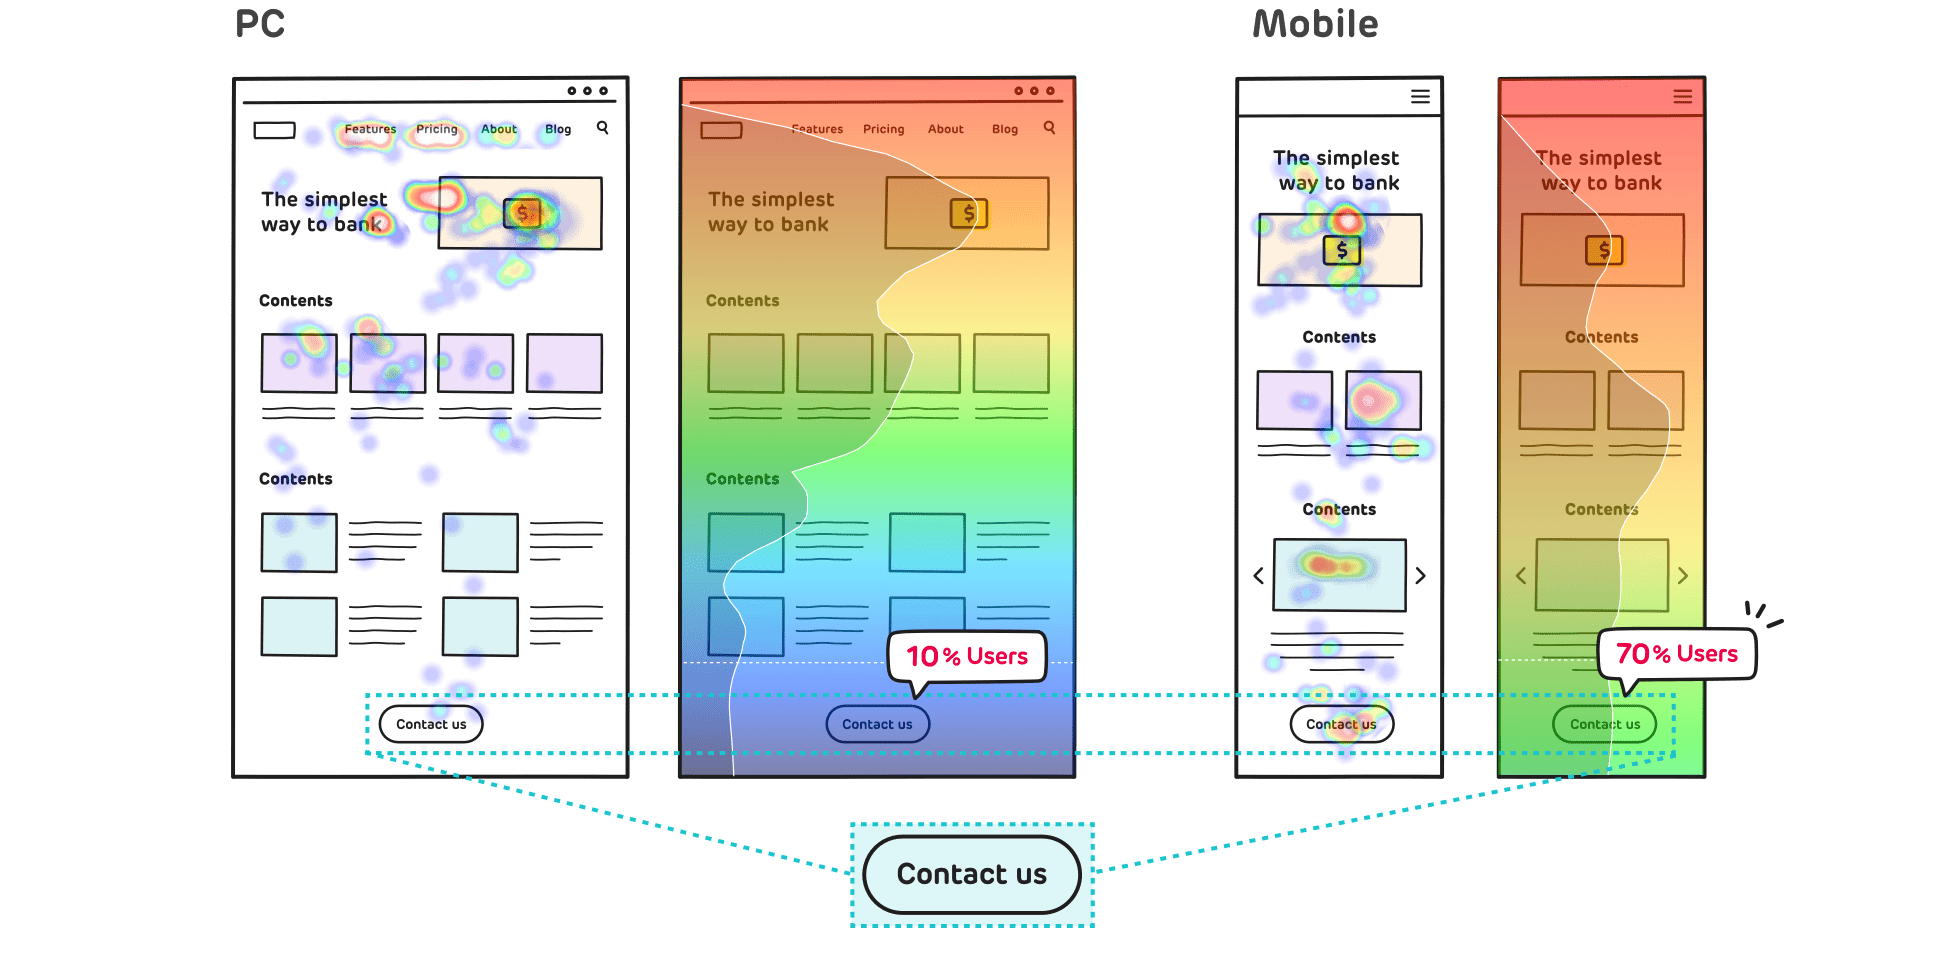
모바일과 PC에 따라 다르게 나타나는 고객의 행동 패턴과 전환 경로를 분석해보세요.
상품을 둘러보고 상담까지 이어지는 모바일 사용자 행태를 반영하여, ‘상품 및 상담 페이지’ 콘텐츠를 보다 강화할 수 있어요.
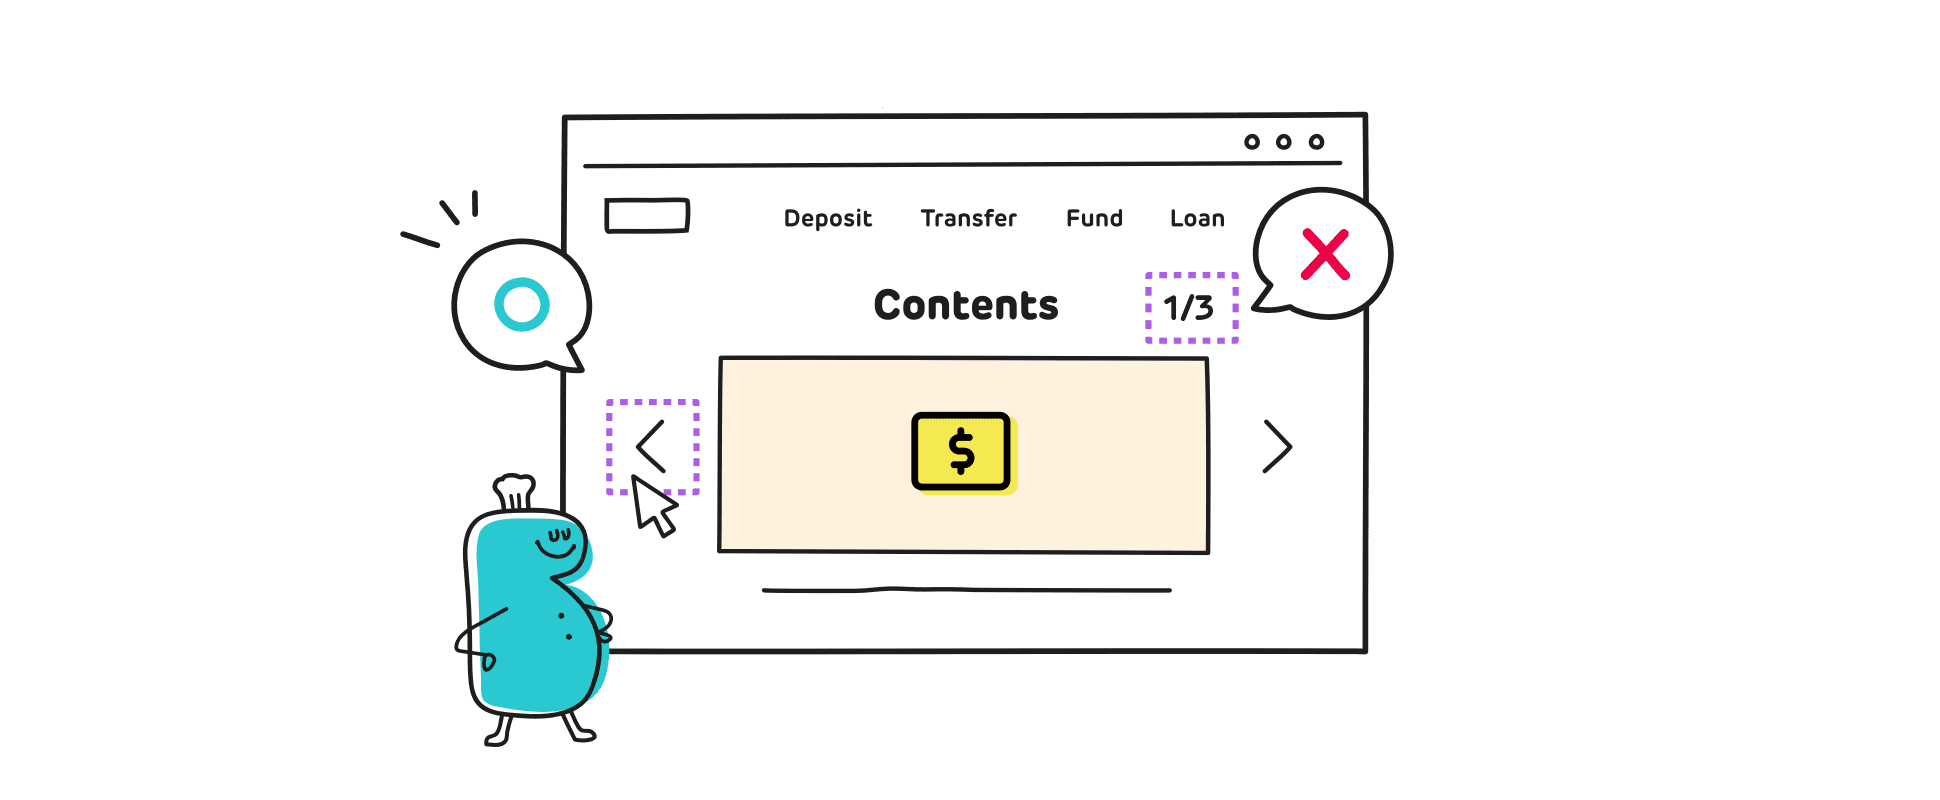
자동으로 갱신되는 이벤트 배너 영역의 낮은 소비 효율을 확인하고
‘다음’ 버튼을 직관적인 디자인로 변경하여 사용자가 캐러셀임을 인지하고 탐색할 수 있도록 개선해 보세요.
검색 결과에 진입한 수강생들은 어떤 패턴으로 탐색을 이어가는지 분석한 후, 카테고리 분류나 정보 레이아웃 구성이 적절할지 점검하여 수강생이 원하는 강의와 정보에 대한 소비 효율을 높여보세요.
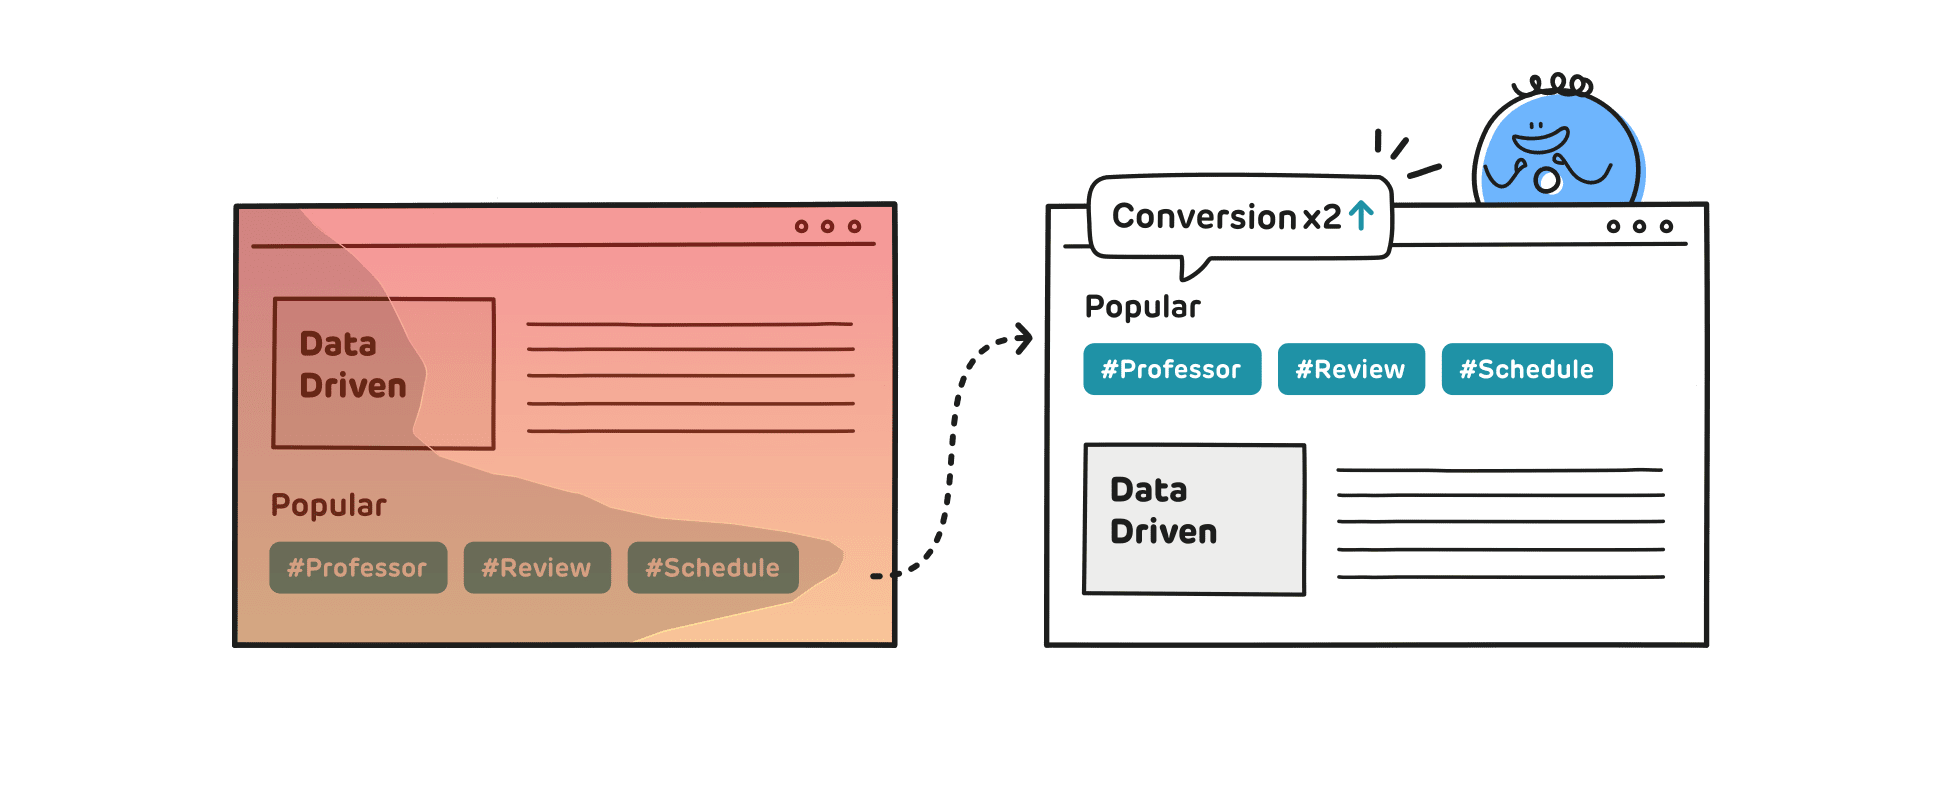
검색 결과에 진입한 수강생들이 ‘연관 검색어’로 재검색을 이어가는 탐색 패턴을 반영하여,
모바일에서 연관 검색어를 상단 영역으로 옮겨 전환을 유도해 보세요.
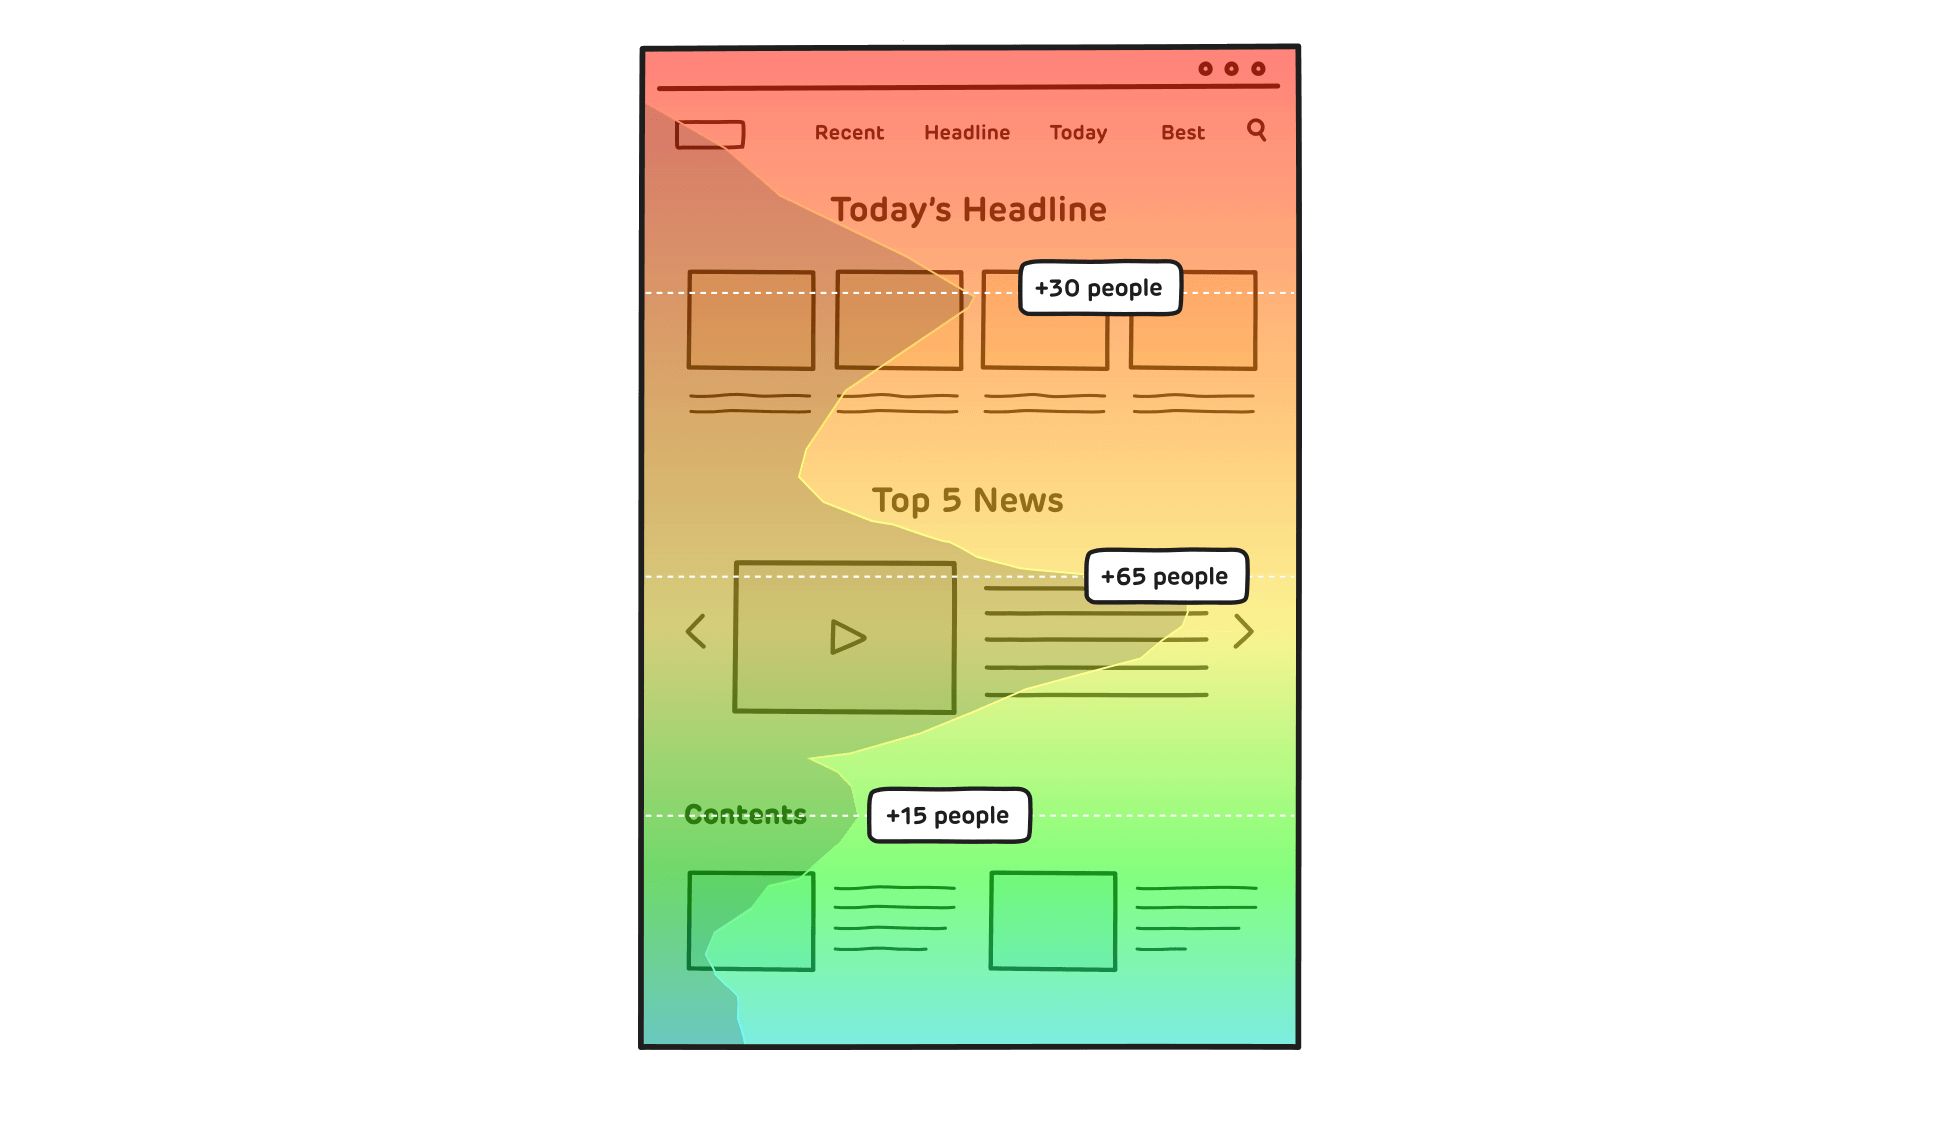
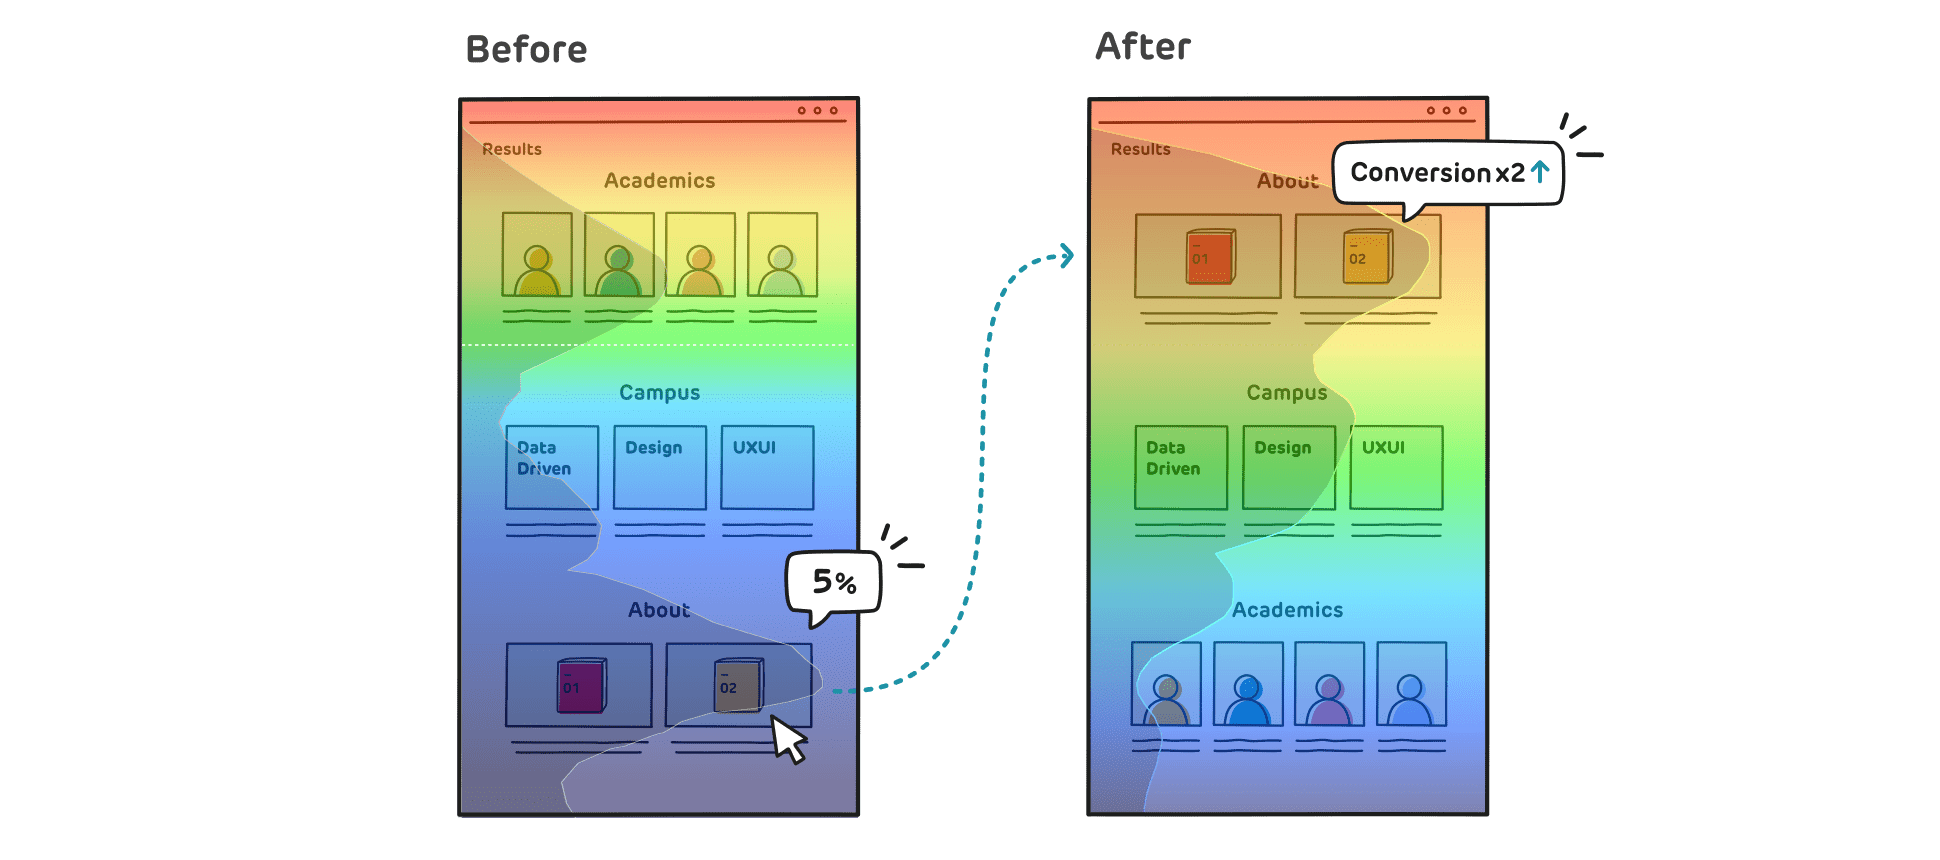
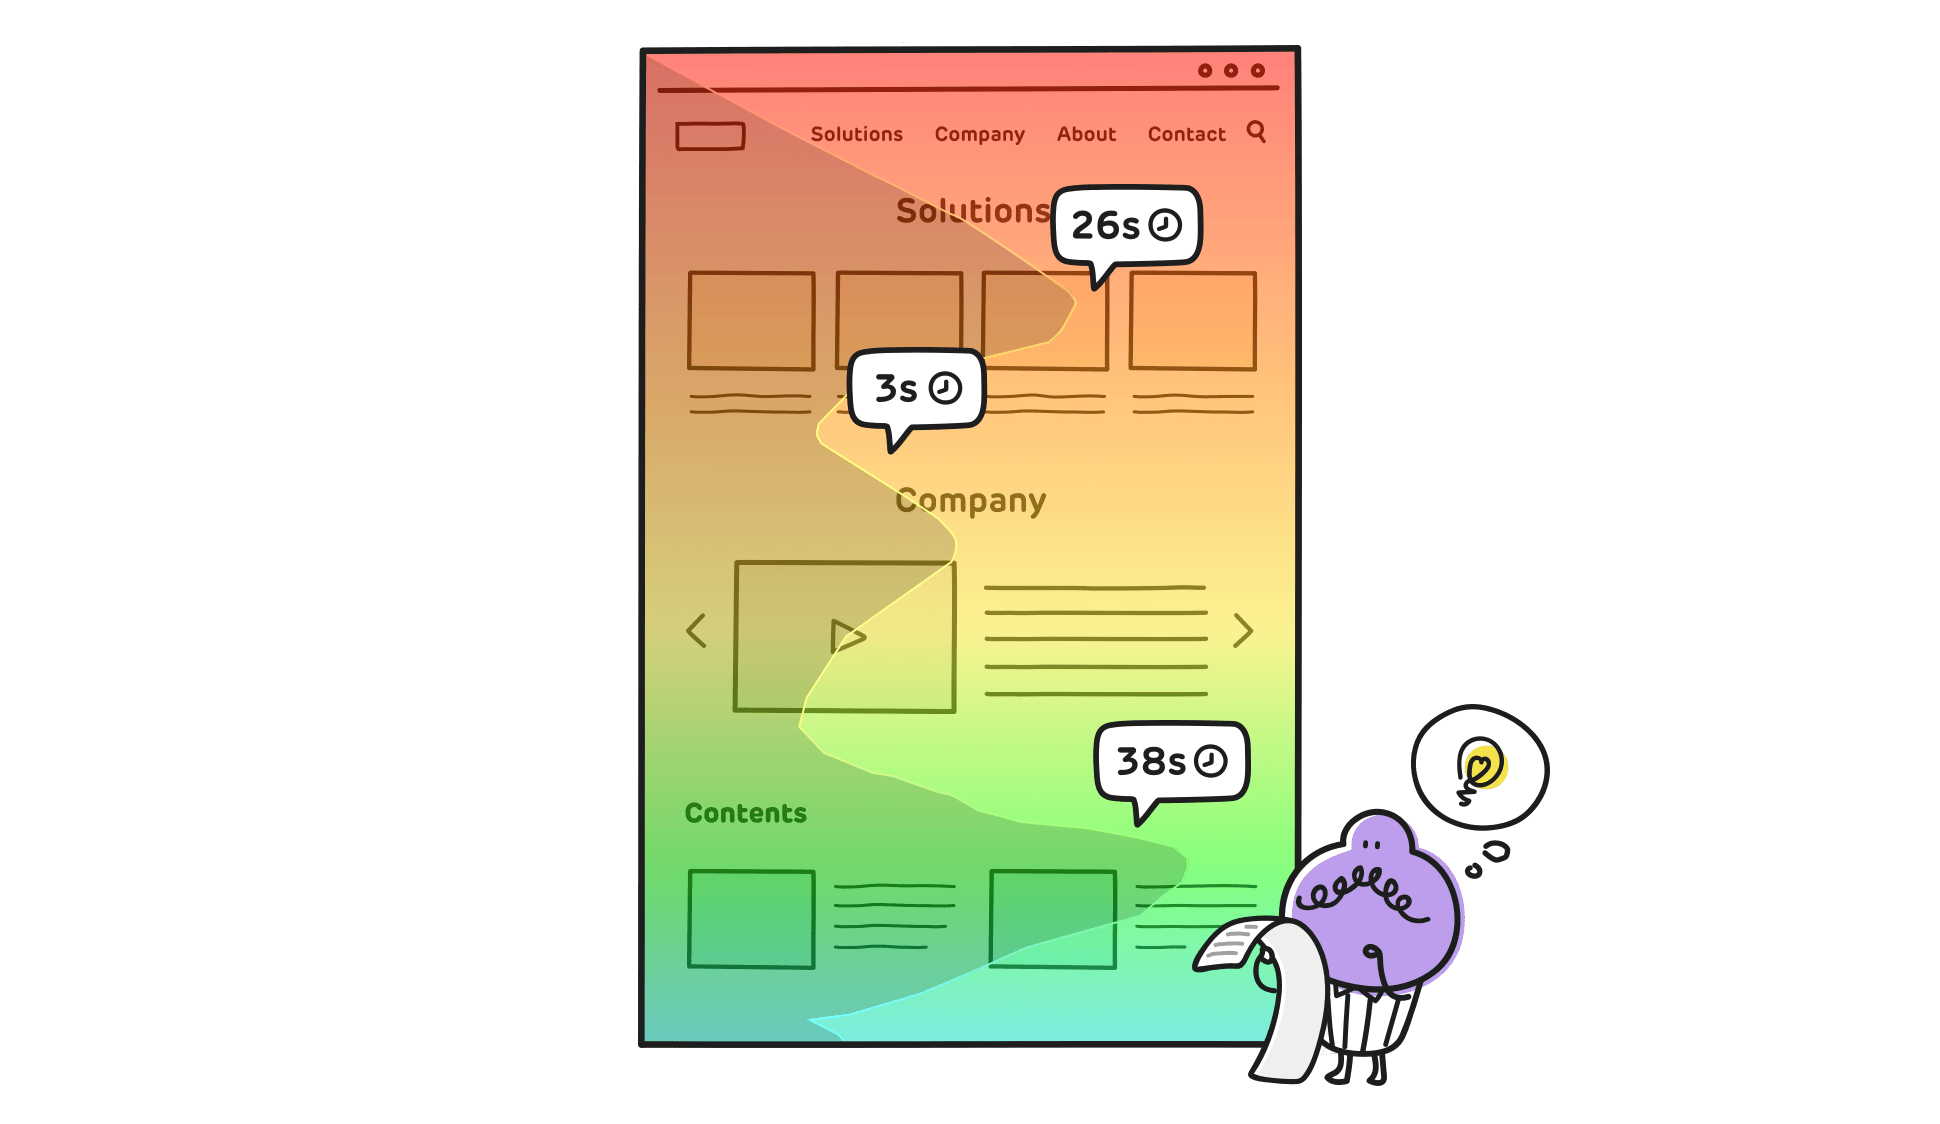
페이지 하단에 위치한 컨텐츠까지 얼마나 도달하는지, 중단율이 가장 큰 구간을 확인하세요. 페이지 효율이 높은 구간에 주요 컨텐츠를 배치하고, 하단에도 콘텐츠가 계속됨을 인지할 수 있도록 UI를 개선해 보세요.
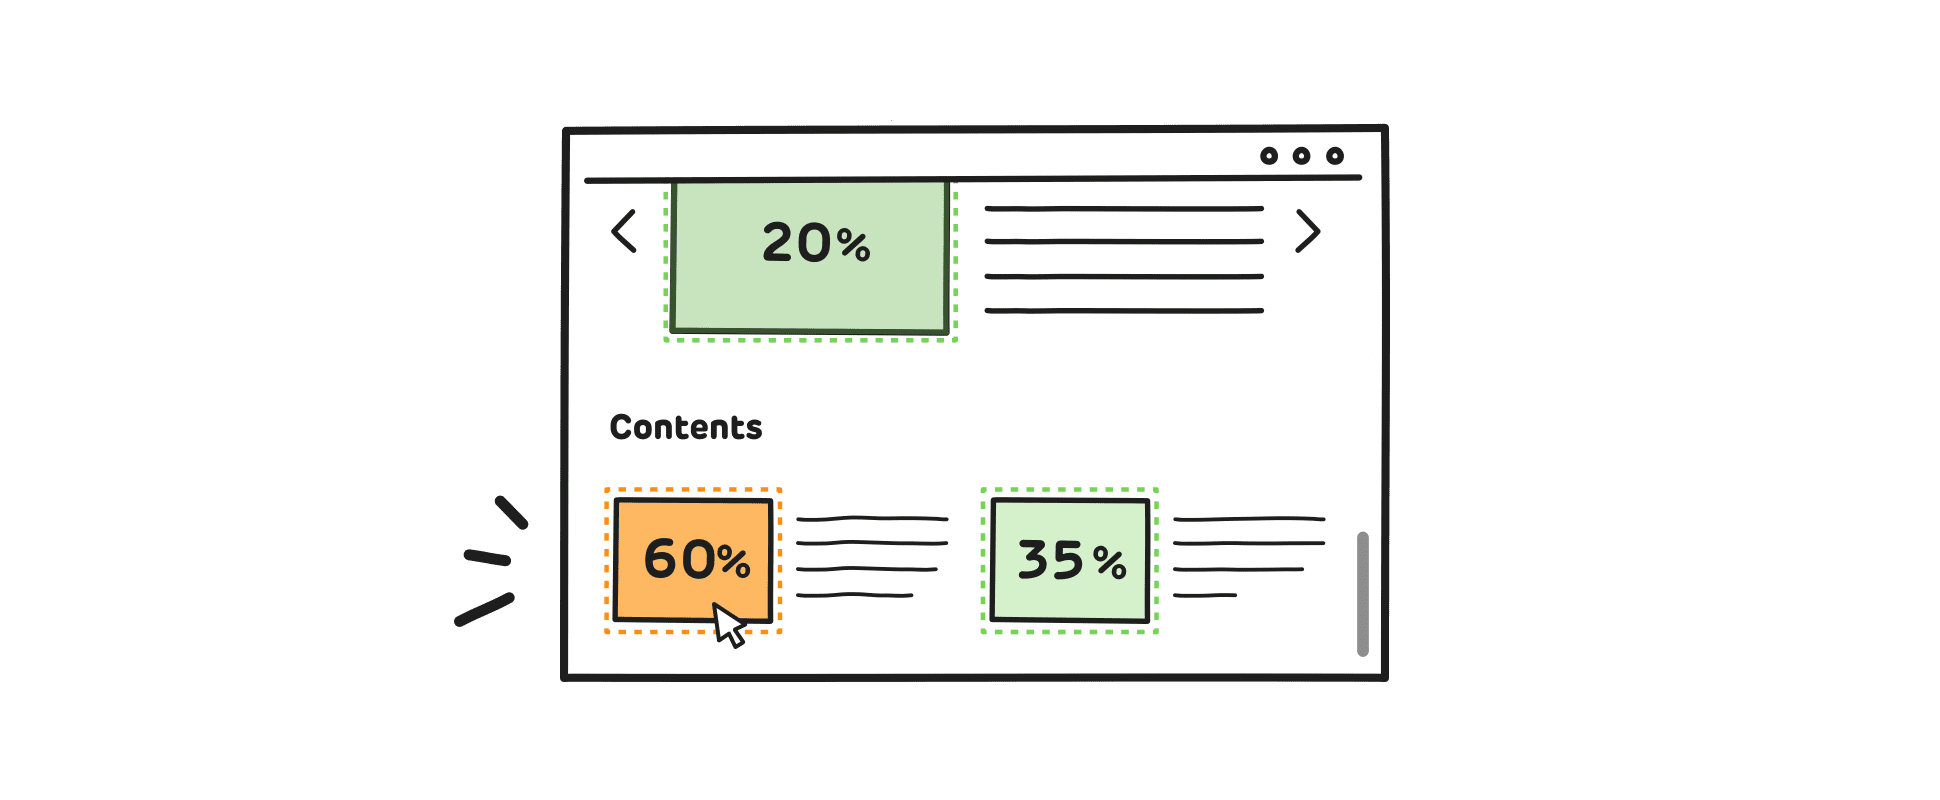
페이지 하단에 있지만 도달한 사용자들 대부분이 주목한 컨텐츠가 무엇인지 확인해 보세요.
니즈가 높은 컨텐츠는 상단으로 레이아웃을 변경하여 컨텐츠 전환을 유도할 수 있어요.
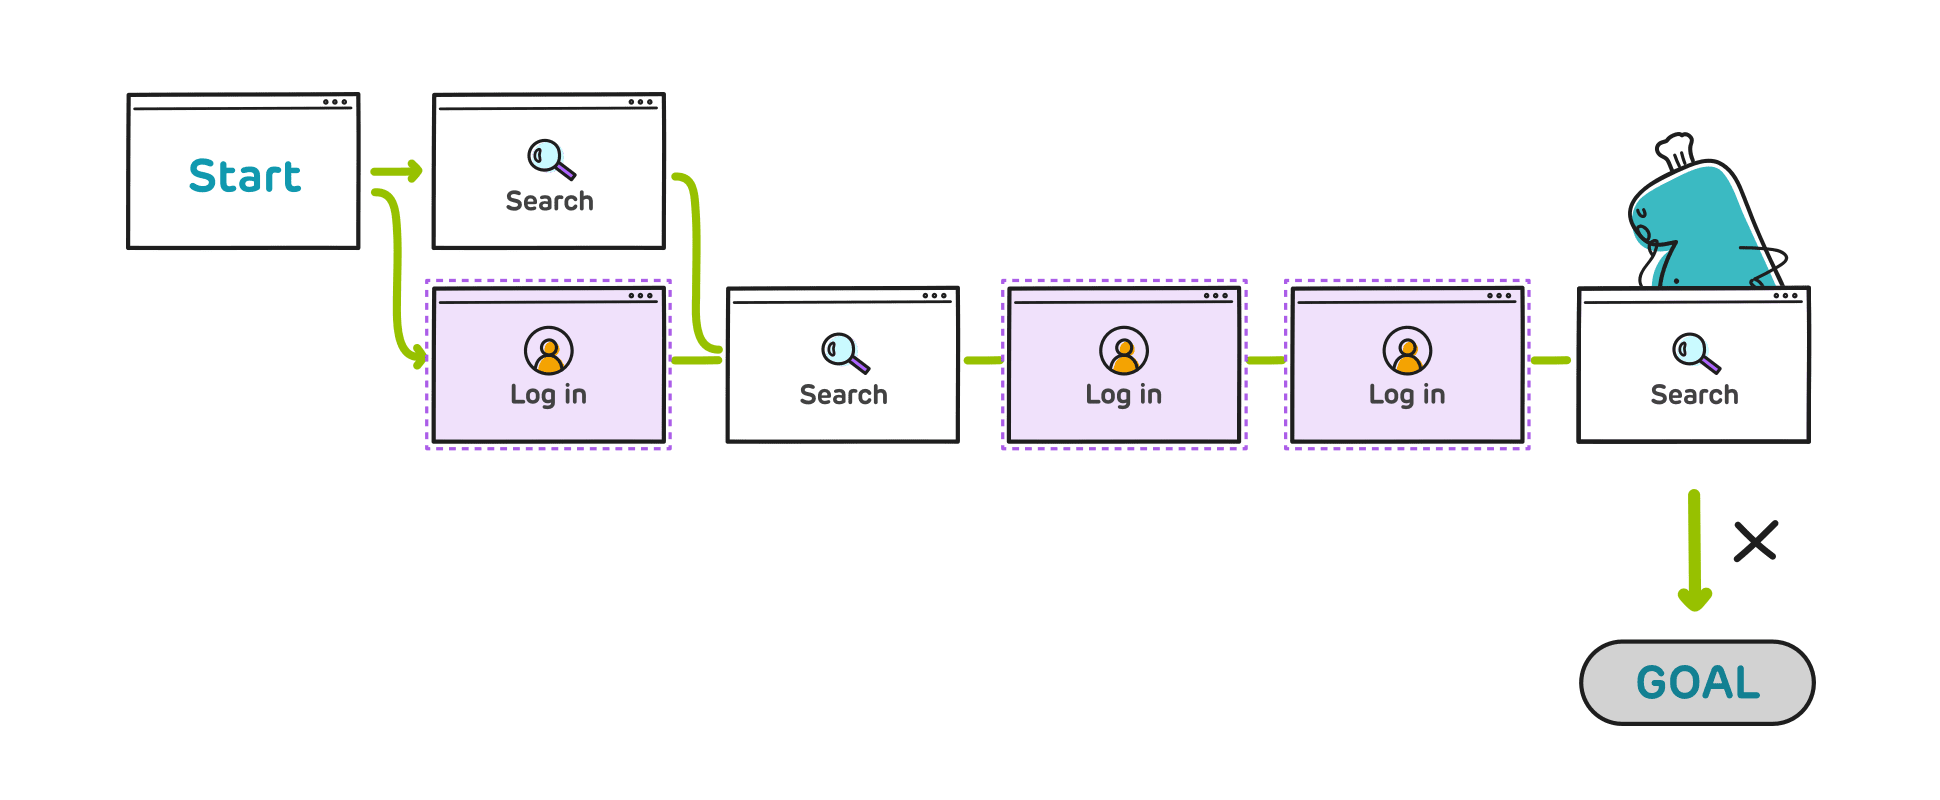
민원 신청까지 도달하지 못하고 재검색을 이어가는 사용자의 흐름을 확인하고,
검색 결과 페이지에서의 탐색 패턴과 반복된 로그인 프로세스를 점검해볼 수 있어요.
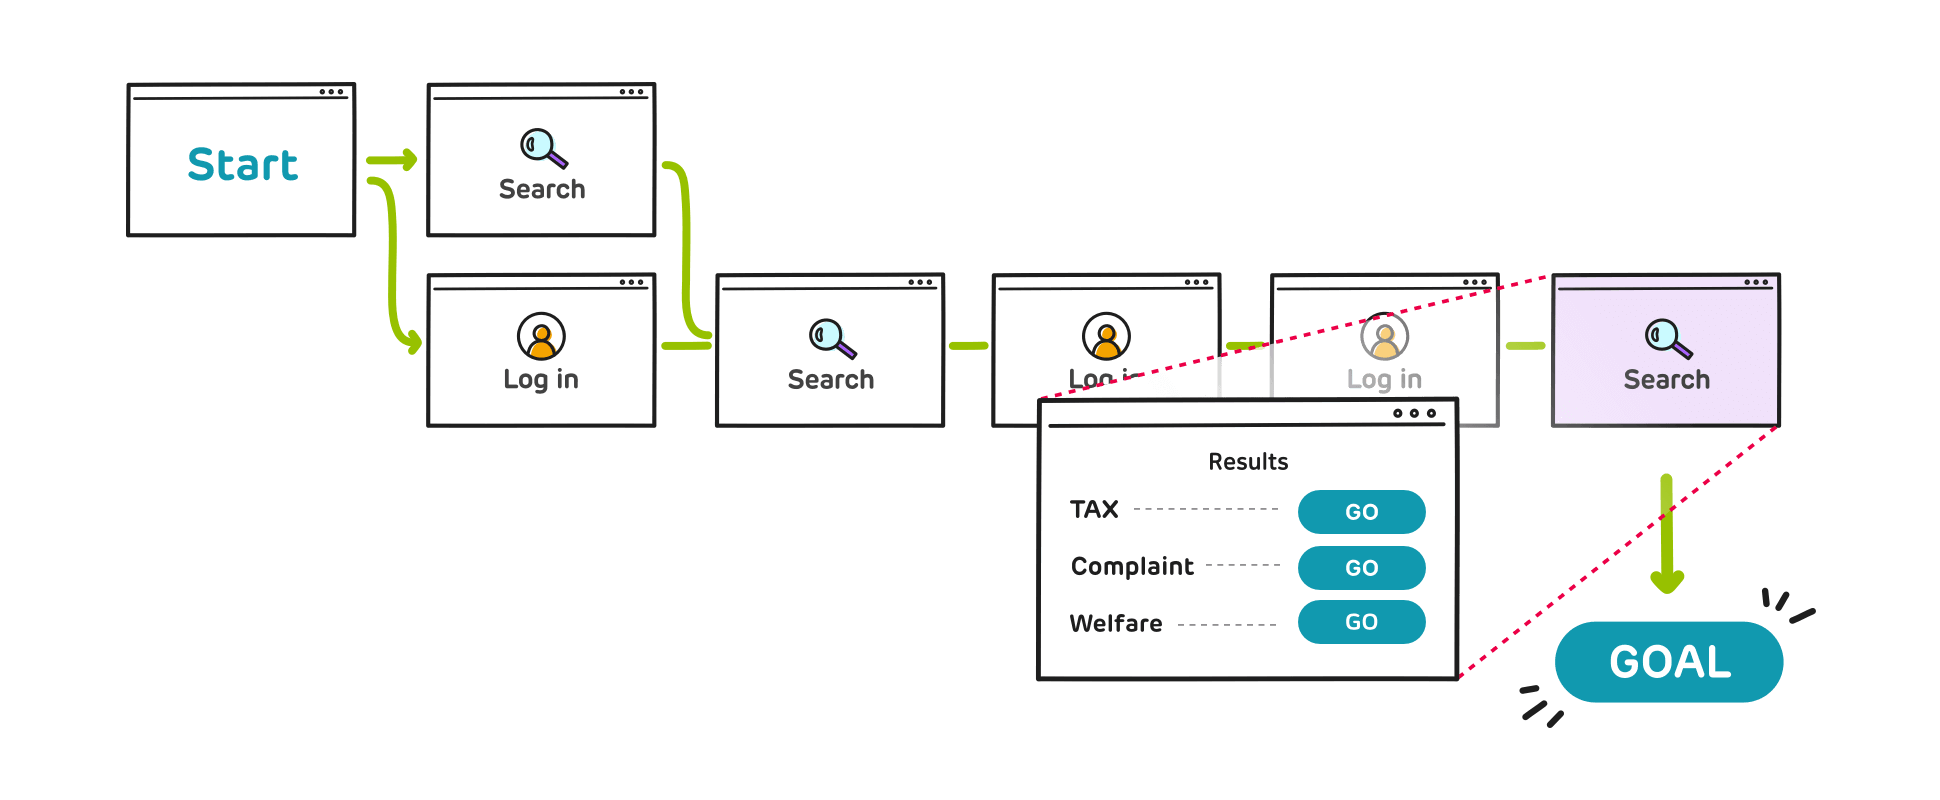
서비스 신청에 대한 니즈를 반영하여, 검색 결과 페이지에서 서비스 신청으로 바로 진입할 수 있도록 경로를 제공하세요. 또 원하는 서비스를 카테고리별로 빠르게 찾을 수 있도록 검색 결과 분류를 추가할 수 있습니다.
고객이 페이지를 하단까지 꼼꼼하게 살펴보는지, 예상 외로 관심도가 높았던 컨텐츠를 데이터로 확인하세요.
또 개선 후에는 도달률과 체류시간 데이터로 쉽게 성과를 검증할 수 있습니다.
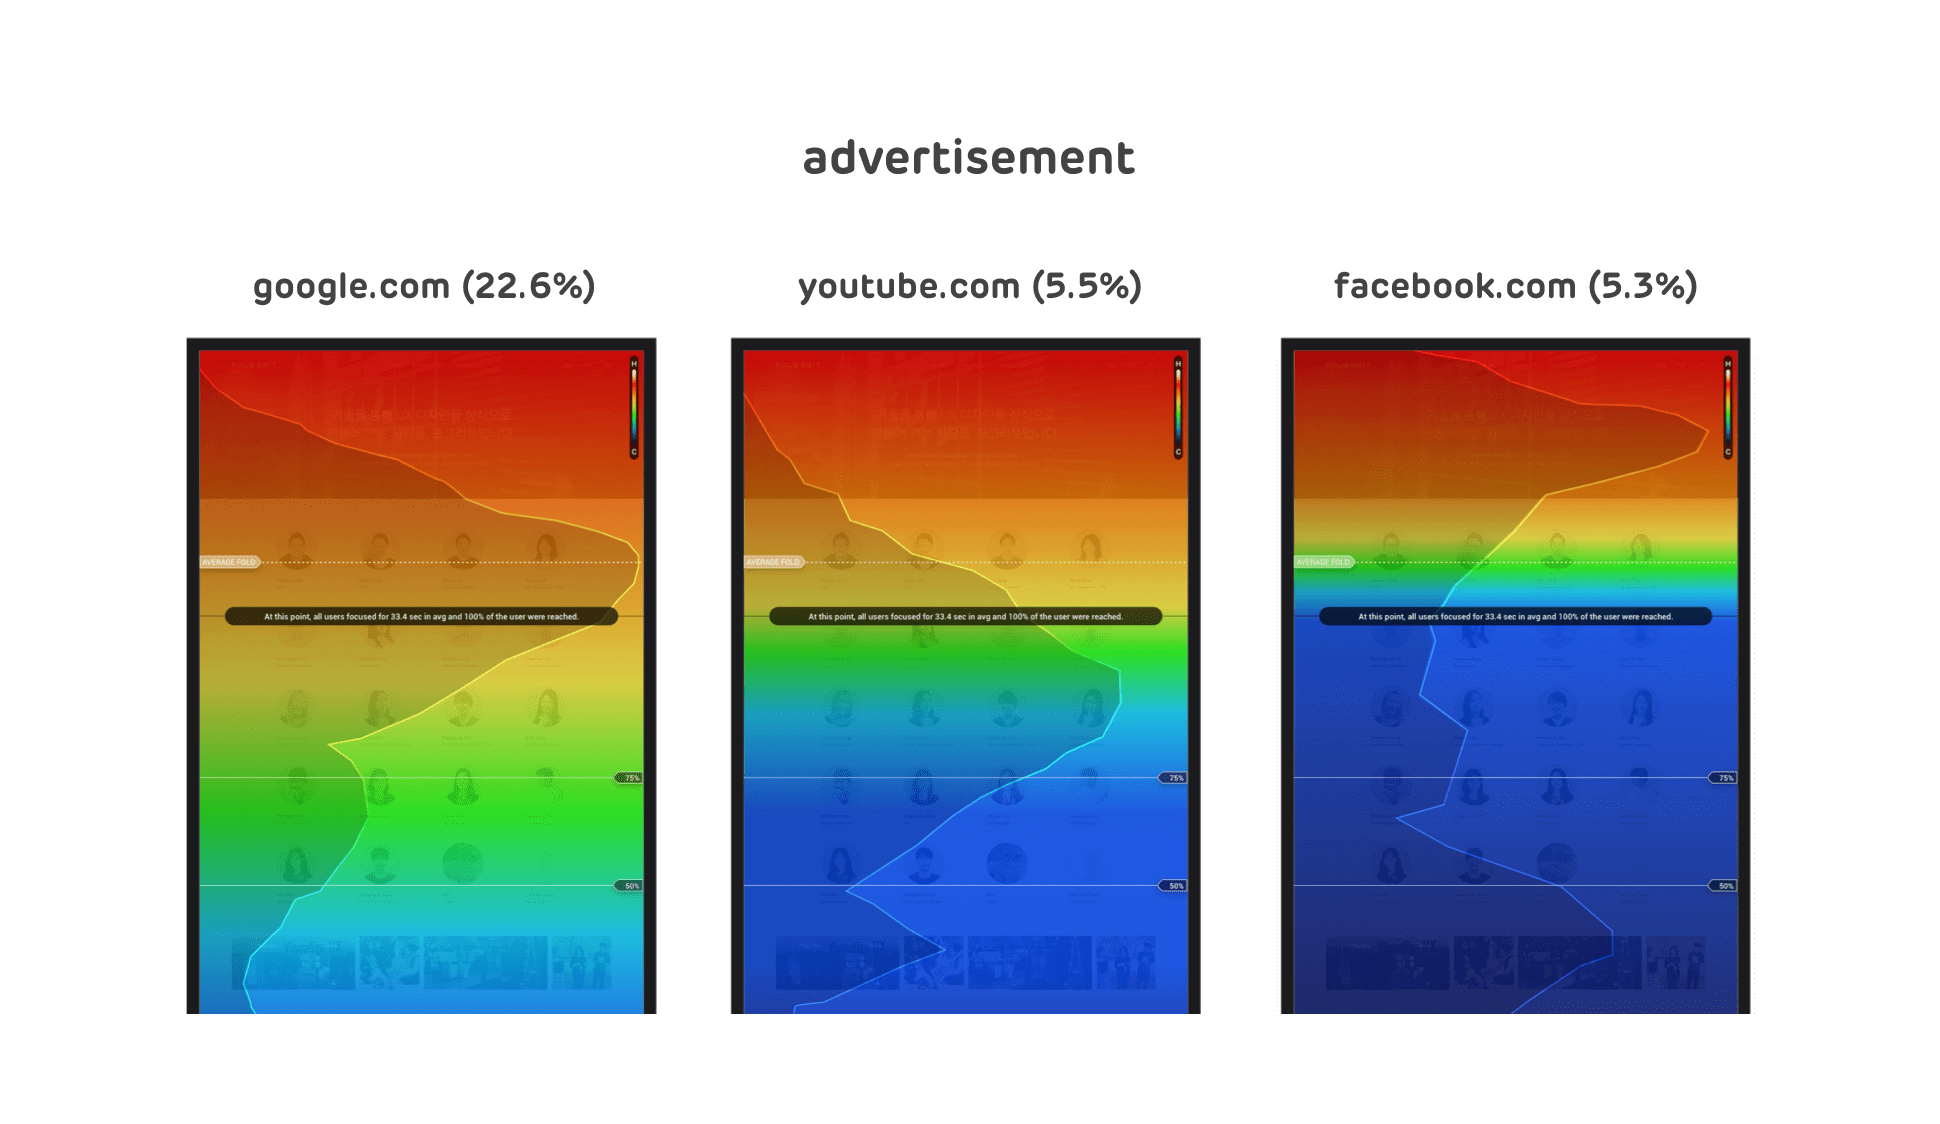
광고별로 최종 목적지까지 도달하는 고객 여정과 패턴을 확인하고 성과가 좋은 광고에 집중해 보세요.
다른 직무에 종사하는 실무자들을 설득할 때 시각화된 자료가 큰 도움이 됩니다.