You can see the user's intent, needs, process, and pain point at a glance. Data analysis with heatmaps instead of numbers! It's easier than you think.
Visualizing UX data
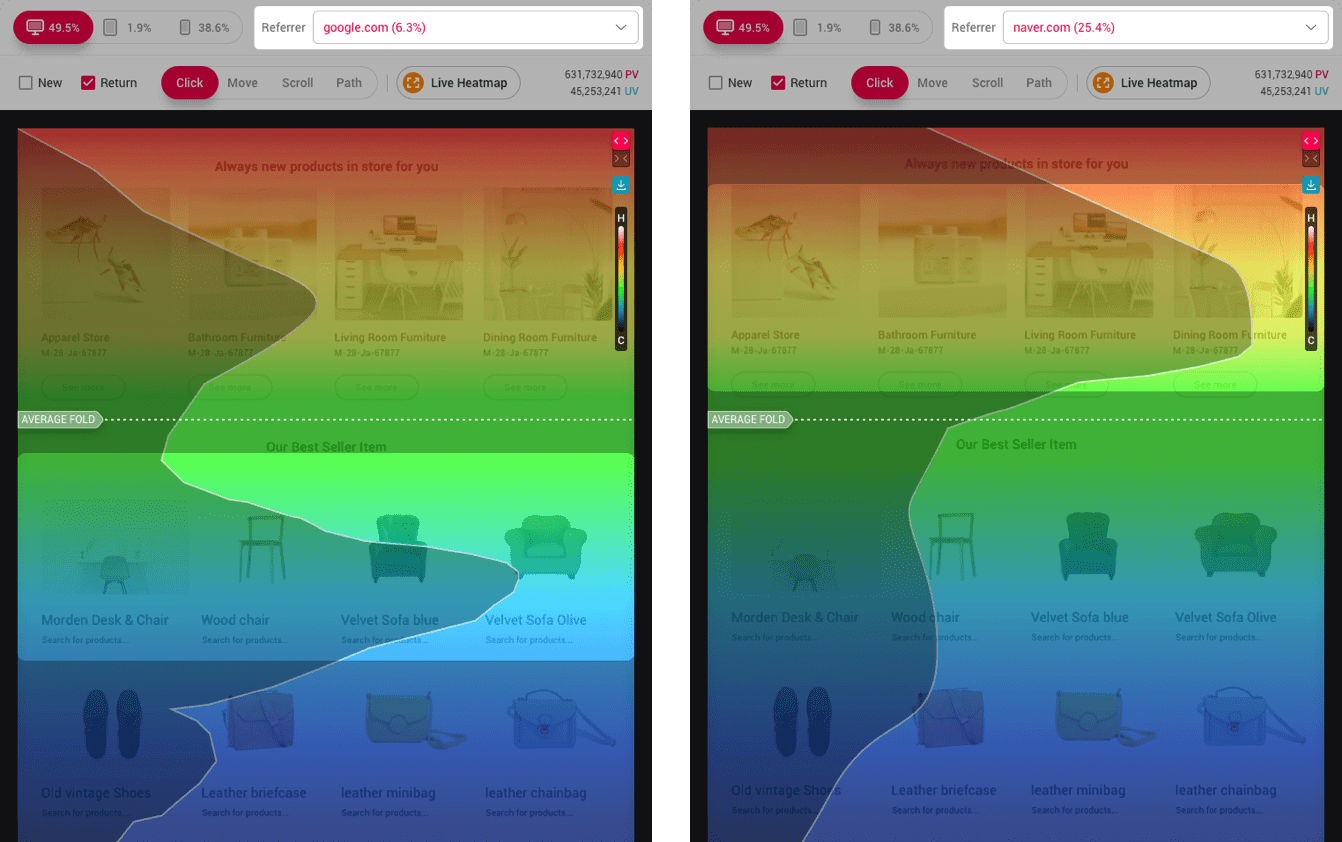
You can discover which elements lead to high conversion, which content received the most attention, and content that can be repositioned for better delivery.
Identify user needs and navigation patterns with various heatmaps that reflect device-specific interactions!
Finding unexpected pain points
User patterns do not always follow expectations. See if the UI's complexity is a pain point that requires potential optimization.
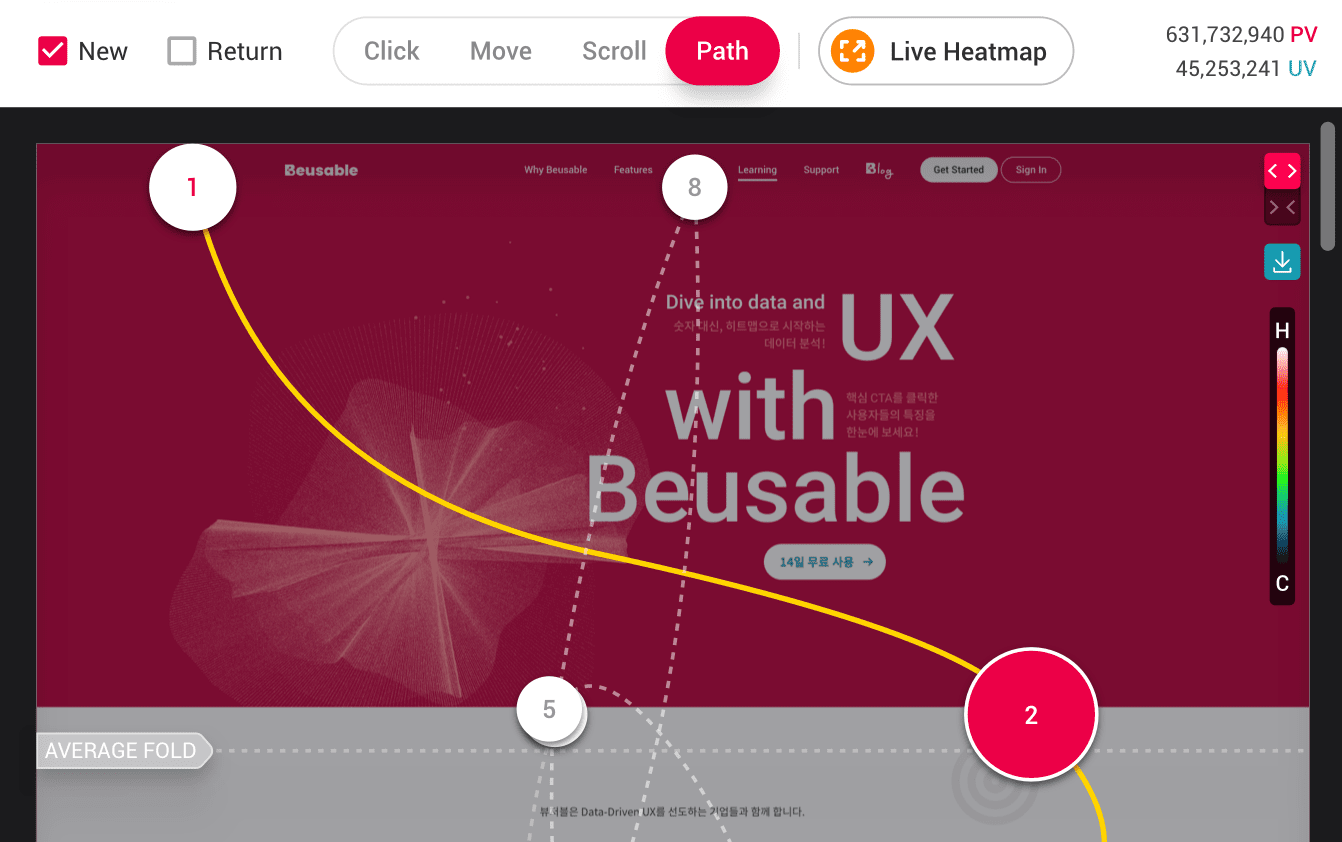
Navigation flow of potential leads
Find out how far your leads navigated after selecting an important CTA. You can build strategies based on their interest to change them to loyal customers.
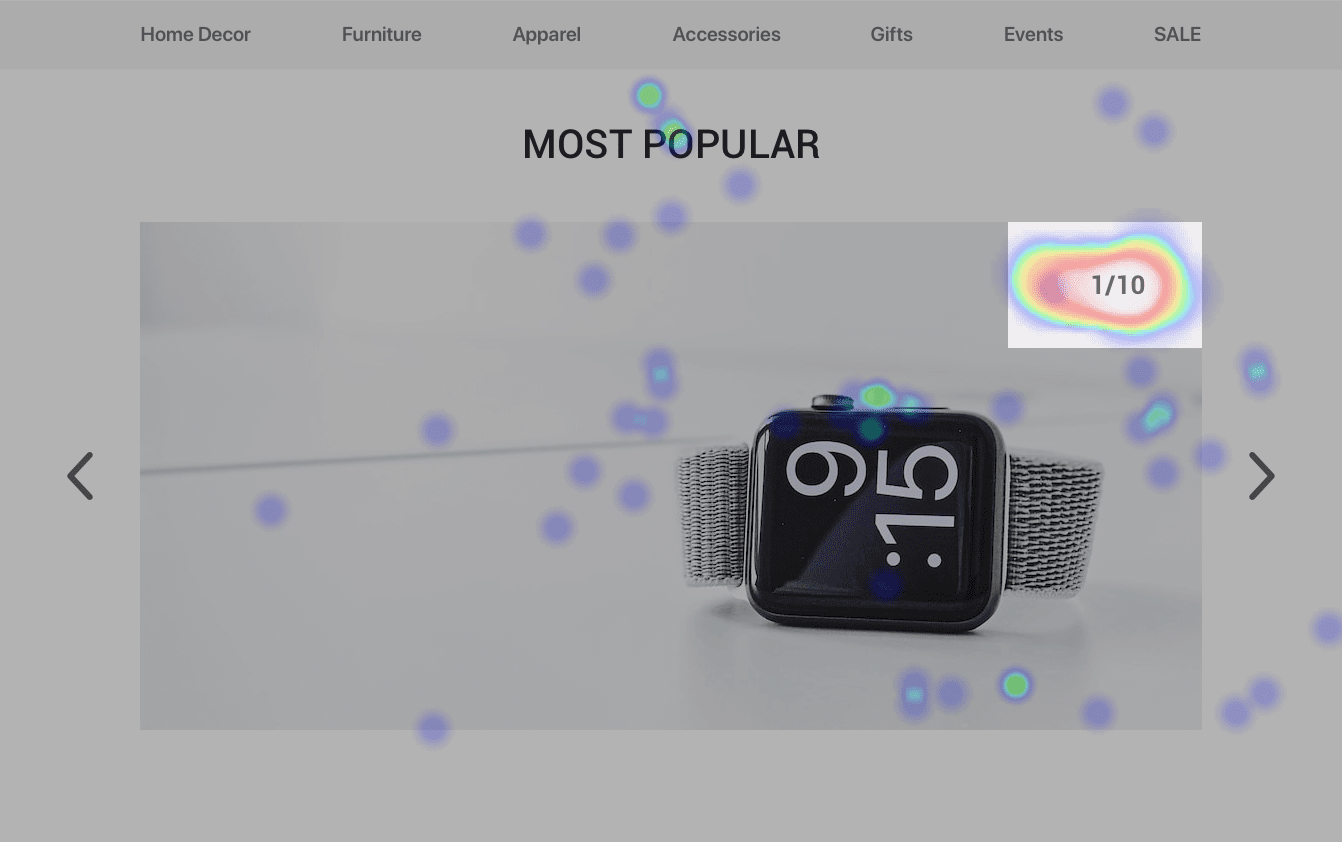
Live analysis of hidden content
Just like your users, navigate your live site then find the best placement of interactive, hidden UI elements such as carousels and hamburger menus.