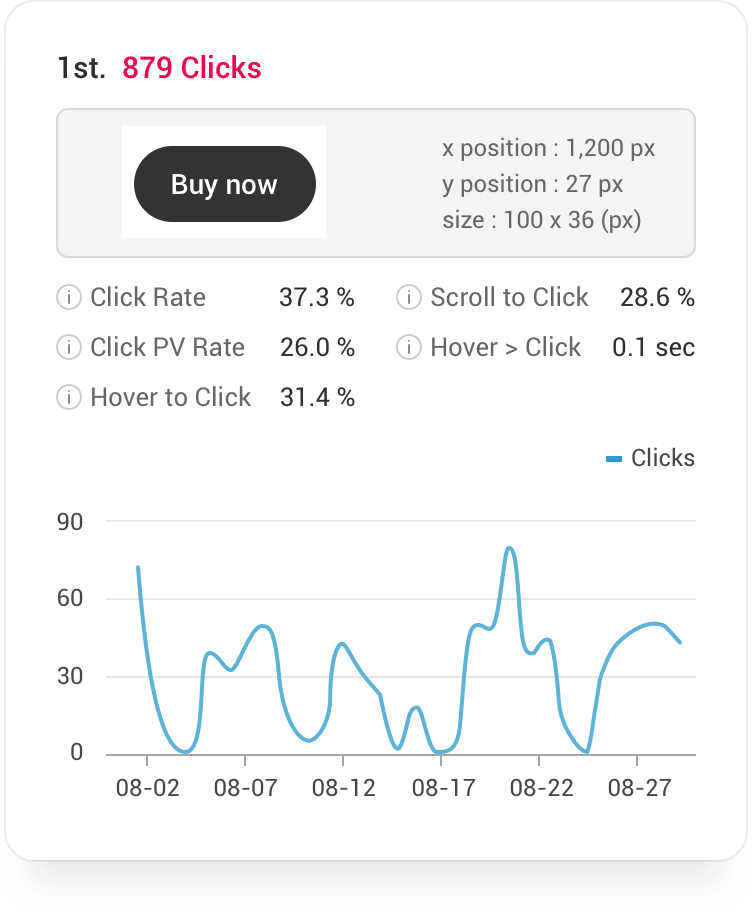
Summarized click and mouse movement metrics
Did interest lead to conversion?
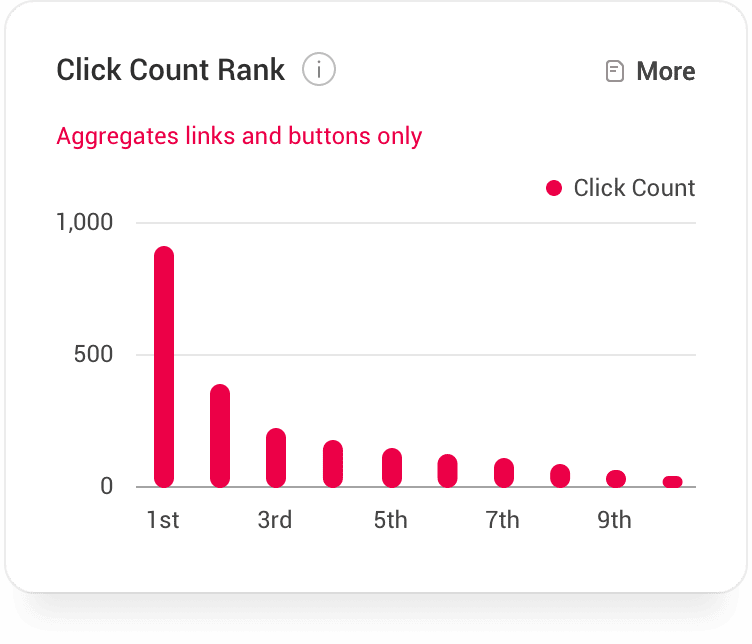
Review your content's efficiency through various click and move metrics.
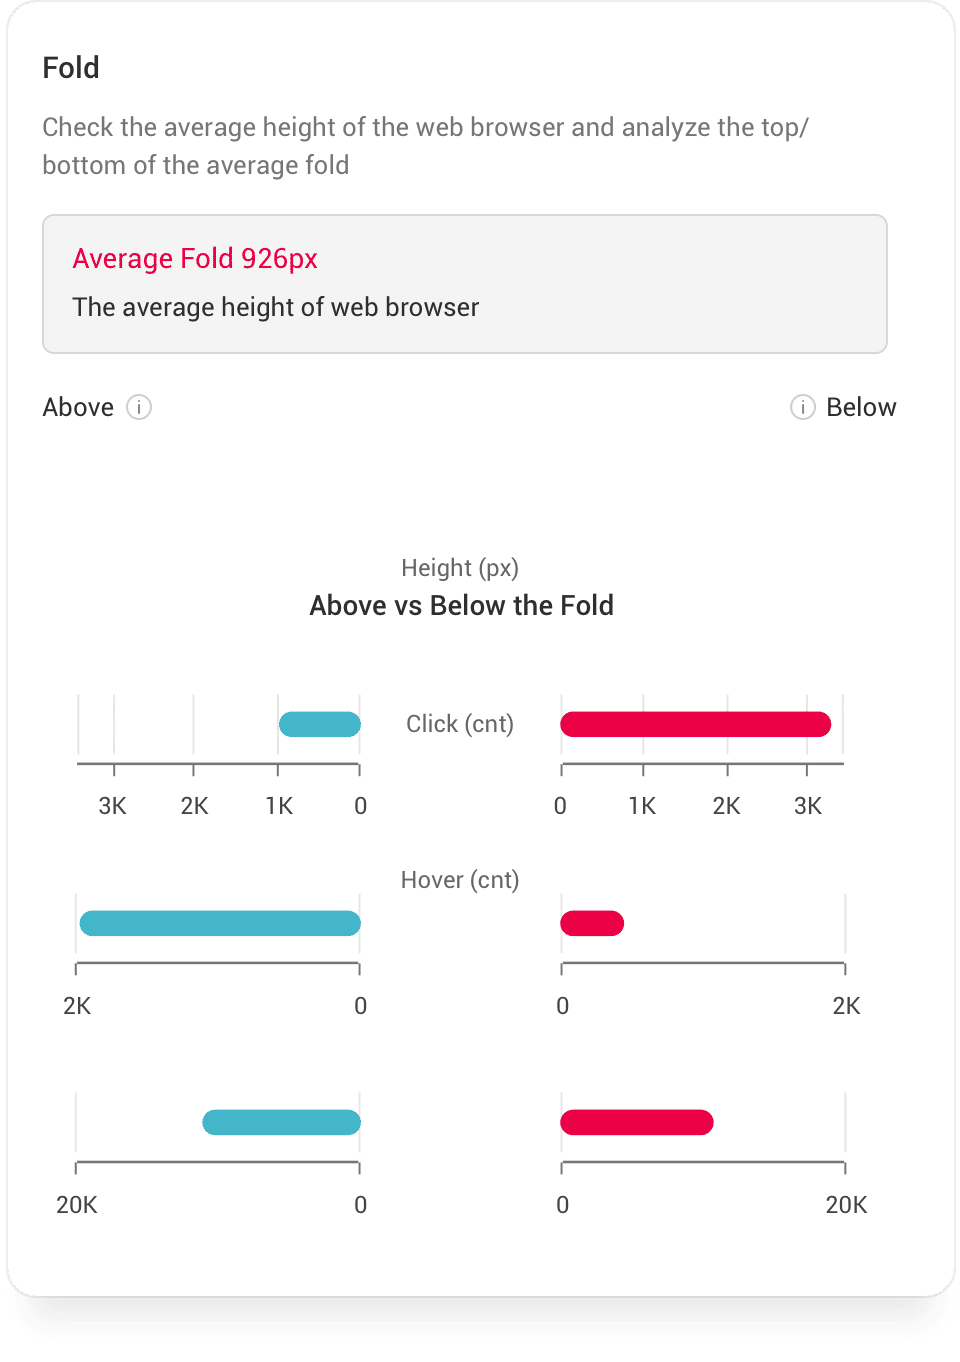
See your page's efficiency at a glance!
You can support your layout optimizations with the scrolled heights and interaction overview based on the average fold.
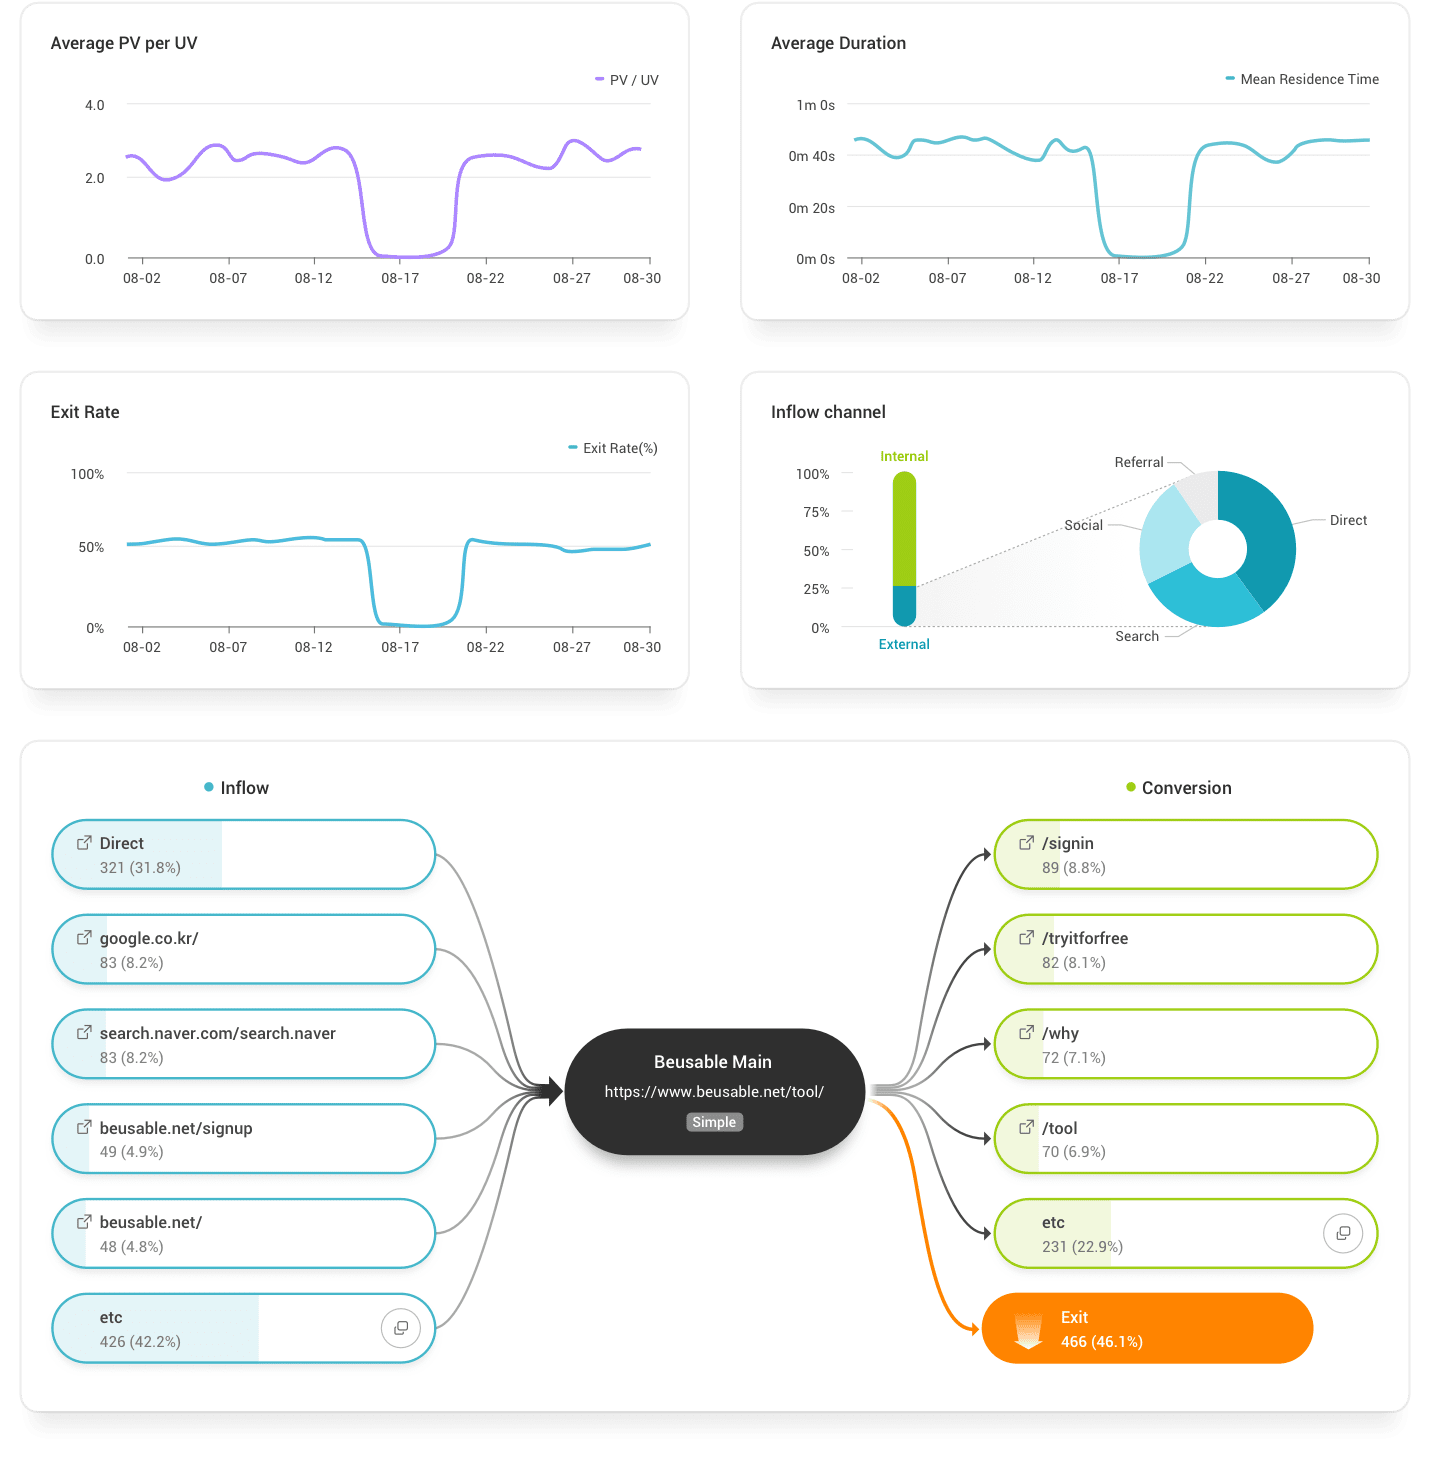
Data to help you understand your users
Find summarized key information from exit rate, average duration, traffic channels, navigation flow, and more.
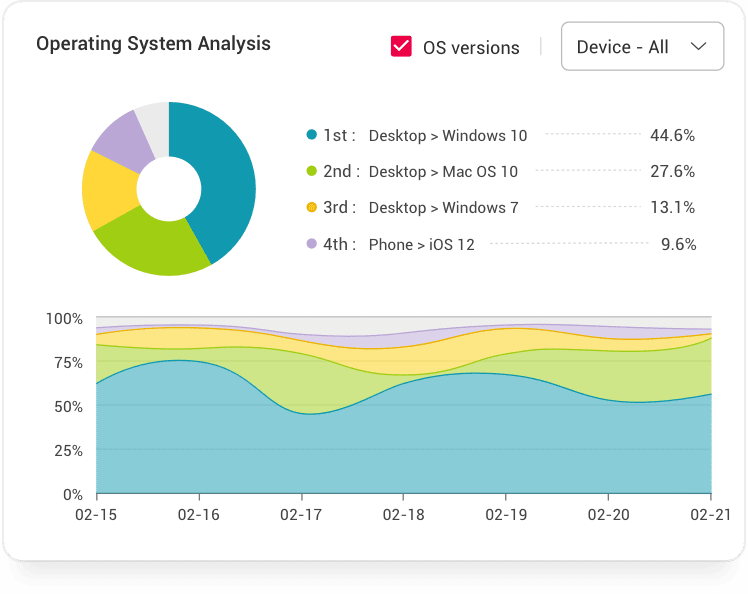
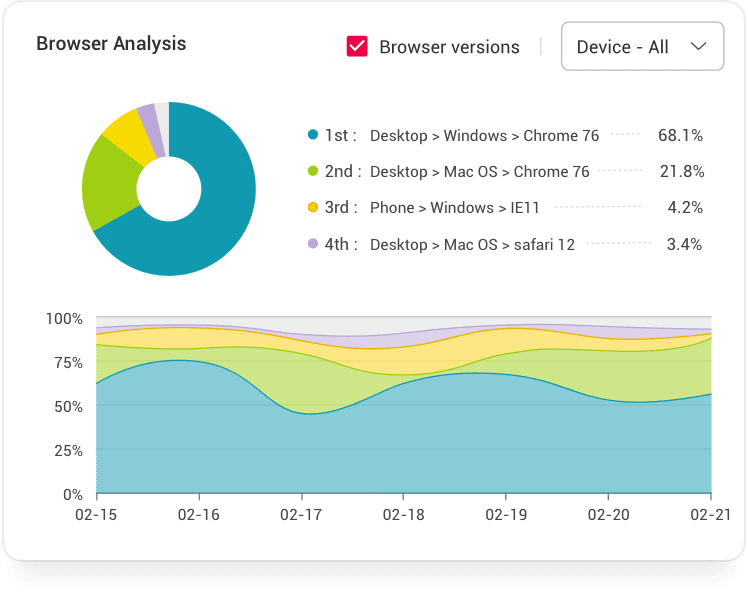
User environment statistics
Base your strategies and priorities based on information about your users' access environment such as country, device, and screen size!